

Maximum Borrowing Capacity: Does Borrowing Your Limit Create More Wealth or More Risk?
Borrowing your maximum capacity does not automatically create more wealth. For some investors it accelerates portfolio growth; for others, it freezes the portfolio entirely when rates rise or circumstances change.
The lender's approved ceiling and the amount you should borrow are two very different numbers. The gap between them is where strategy lives. Understanding what drives your borrowing capacity and how far below that ceiling you should sit is one of the most consequential decisions in property investing, yet most guides stop at the calculation.
What Is Maximum Borrowing Capacity?
Maximum borrowing capacity is the highest dollar amount a lender will approve you to borrow based on your income, living expenses, existing debts, and how the bank models your ability to repay. It is not a fixed number. It shifts with interest rates, your personal financial position, and the lender's own internal criteria.
One distinction most borrowers miss: your maximum borrowing capacity is defined by the bank's assessment model, not by what you can comfortably live on. Those two numbers are rarely the same.
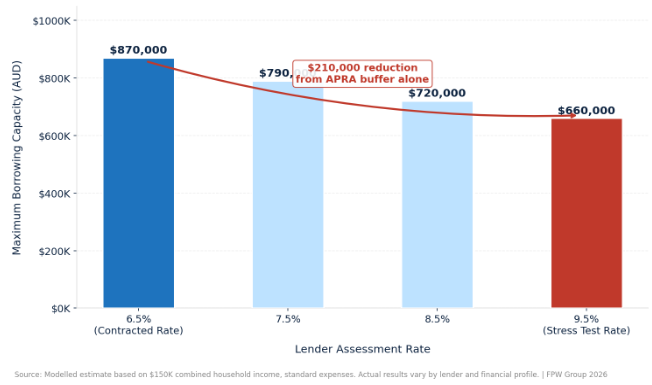
Maximum Borrowing Capacity by Assessment Rate
Source: Modelled estimates based on indicative household income and standard living expenses. Results vary by lender and financial profile. | FPW Group 2026
How Banks Calculate Your Maximum Borrowing Limit
Banks run your finances through a serviceability model that stress-tests repayment ability at a higher rate than the one you pay. APRA requires all regulated lenders to assess borrowers at the contracted rate plus 3 percentage points. On a loan at 6.5%, the bank is testing whether you can repay at 9.5%. That gap alone accounts for a significant reduction in what a lender will approve.
Understanding the borrowing capacity formula is where any serious investment plan should begin. It reveals that your "maximum" is already conservative by design, tested against a future that has not happened yet.
FOR EXAMPLE
A borrower with a $150,000 combined household income and no existing debts might qualify for approximately $870,000 at the contracted rate. Run through the serviceability buffer at 9.5%, that figure drops to roughly $660,000. The 3% buffer requirement alone accounts for $210,000 in reduced capacity before a single repayment is made.
Your debt-to-income ratio sits alongside serviceability as a second structural ceiling. Most major lenders apply an informal DTI cap of around 6x gross income. For a household earning $150,000, that puts total debt scrutiny at around $900,000, regardless of the serviceability calculation behind it.
Does Borrowing More Actually Build More Wealth?
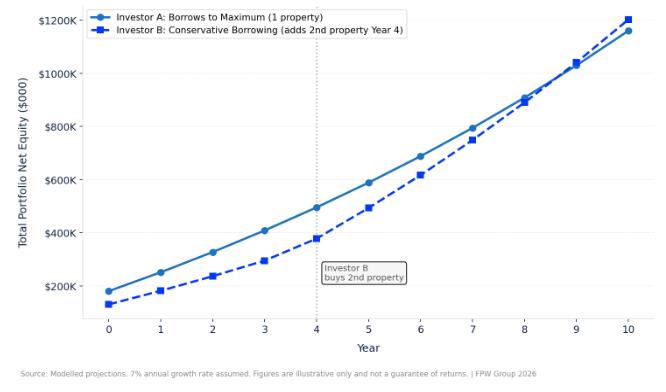
The argument for maximum leverage in property is not irrational. If an asset grows at 7% annually, the difference in absolute return between a $900,000 property and a $650,000 property is meaningful in dollar terms. The issue is not the logic. It is the conditions the logic depends on.
Leverage works well when income is stable, the asset has genuine growth potential, cash flow is sustainable after repayments, and there is a credible path to refinancing or purchasing again within 3 to 5 years. The way property investment interest rates interact with highly leveraged positions means a 1% shift can change the entire calculus. Remove one of those conditions and the wealth argument starts breaking down.
Portfolio Net Equity: Conservative vs Maximum Borrowing Over 10 Years
Source: Modelled projections. 7% annual growth rate assumed. 6.5% P&I loan rate. Figures are illustrative only and are not a guarantee of returns. | FPW Group 2026
The Real Risks of Going to Your Maximum
The risks of borrowing at maximum capacity are rarely visible at approval. They show up later: when a tenant vacates, when a rate rise hits, or when a second property opportunity appears and there is nothing left to borrow. At full capacity, you typically cannot access further credit without selling an asset or waiting years for income and values to improve.
Mortgage stress is typically defined as repayments consuming more than 30% of household income. Borrowed at your ceiling at current rates, you may already sit near that threshold. Understanding why borrowing capacity drops when interest rates rise reveals just how exposed a maximum-capacity position becomes in a rate cycle.
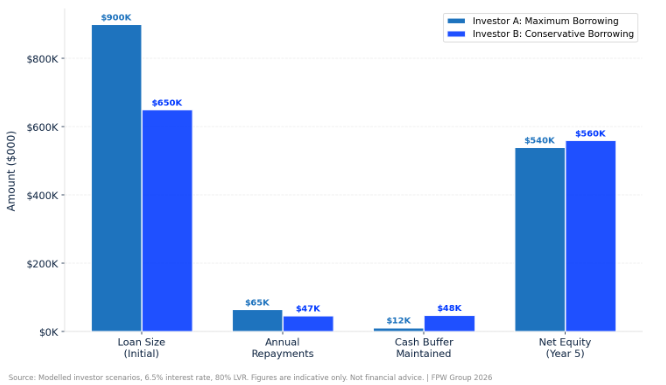
Investor A vs Investor B: 5-Year Financial Position Compared
Source: Modelled investor scenarios. 6.5% interest rate, 80% LVR. Figures are indicative only. Not financial advice. | FPW Group 2026
When Borrowing More Makes Sense (and When It Does Not)
There is a version of maximum borrowing that is genuinely strategic. It usually involves a high-quality, growth-oriented asset in a supply-constrained location, a combined income that can absorb a 2% rate rise without stress, positive or near-neutral cash flow from day one, and a savings buffer equivalent to at least 6 months of holding costs.
It rarely makes sense for first-time investors still learning the market, investors with variable or contract-based income, those already carrying significant personal debt, or anyone within 10 years of retirement where cash flow security starts to matter more than portfolio growth speed.
FOR EXAMPLE
Investor A earns $190,000 combined and buys a well-located inner-Brisbane property at their approximate maximum of $950,000. Yield is 4.2%, cash flow is slightly positive from week one. Six years later the property has grown to $1.35 million. Investor A refinances to release equity and buys again. The maximum-capacity approach worked because the asset, income, and holding period all aligned.
Investor B earns $115,000 combined and borrows to their limit of $680,000, buying in a secondary market at 3.8% yield. Two rate rises later; repayments consume 39% of net income. The portfolio stalls for four years.
How Much Buffer Should You Keep?
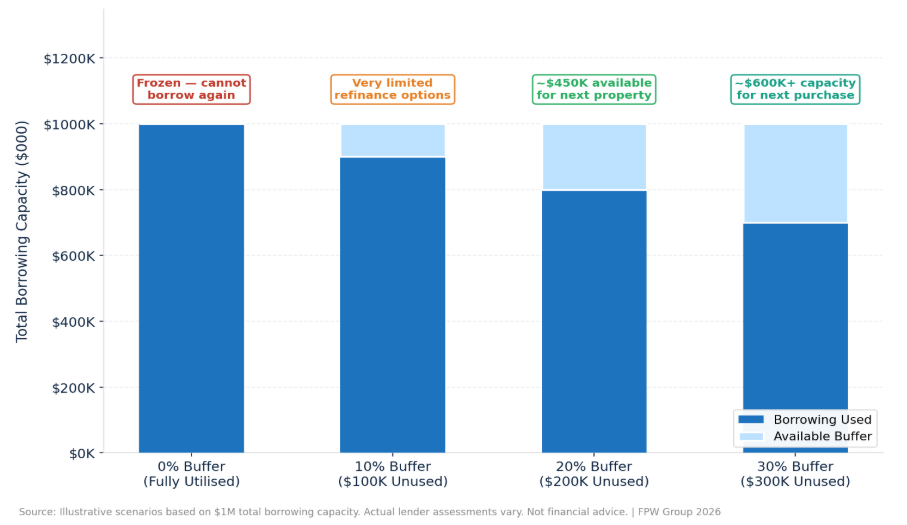
Most experienced advisors suggest leaving 20% to 30% of total borrowing capacity unused. At a maximum limit of $1,000,000, that means deliberately stopping at $700,000 to $800,000. The reasoning is not conservatism for its own sake.
Lenders reviewing a second loan application look closely at DTI. If that ratio is already pressing against the informal 6x ceiling, the application will face friction regardless of the property's quality or the investor's track record. Knowing how to increase borrowing capacity matters far less than never needing to recover from a position where it has been fully exhausted.
How Your Borrowing Buffer Determines Your Next Portfolio Move
Source: Illustrative scenarios based on $1M total borrowing capacity. Actual lender assessments vary by income, DTI, and policy. Not financial advice. | FPW Group 2026
Final Thoughts
Borrowing your maximum capacity is a tool with specific conditions under which it works. Most investors encounter it in conditions where it creates more risk than reward, and the consequences are not always immediately obvious.
The lender's approved ceiling defines what you can access. What you do with that ceiling is a financial and strategic decision no lender makes on your behalf. Starting with your cash flow position at rates 1.5% above current, your DTI, and your timeline to the next purchase will give you a clearer picture than any approval letter.
Frequently Asked Questions
Recommended Reading
Two pages selected based on what readers of this article are most likely to need next.
Recommended Video
Most investors are still positioned in capital cities — but in 2026, that allocation gap is creating real opportunity cost. In a market where timing, positioning, and yield profiles compound into long-term outcomes, that disconnect matters more than most people realize.