

Property Market in Australia: How to Read the Market and Spot Growth Opportunities (Before Everyone Else)
Most investors read the property market in Australia through headlines. A strong month in one capital city, or a forecast predicting a slowdown, and decisions get made on whatever story is loudest that week.
Population growth, vacancy rates and infrastructure spending move first, with prices following months later. This guide sets out a short framework for property investment in Australia using the data that moves first.
Why Understanding the Property Market in Australia Matters
Property news reports what already happened. A single auction result becoming a national trend overnight tells investors little about where value is building.
Property investment in Australia rewards buyers who separate noise from signal. The indicators below move before prices do, and reading them consistently is what finds growth early.
How the Property Cycle Shapes Timing and Opportunity
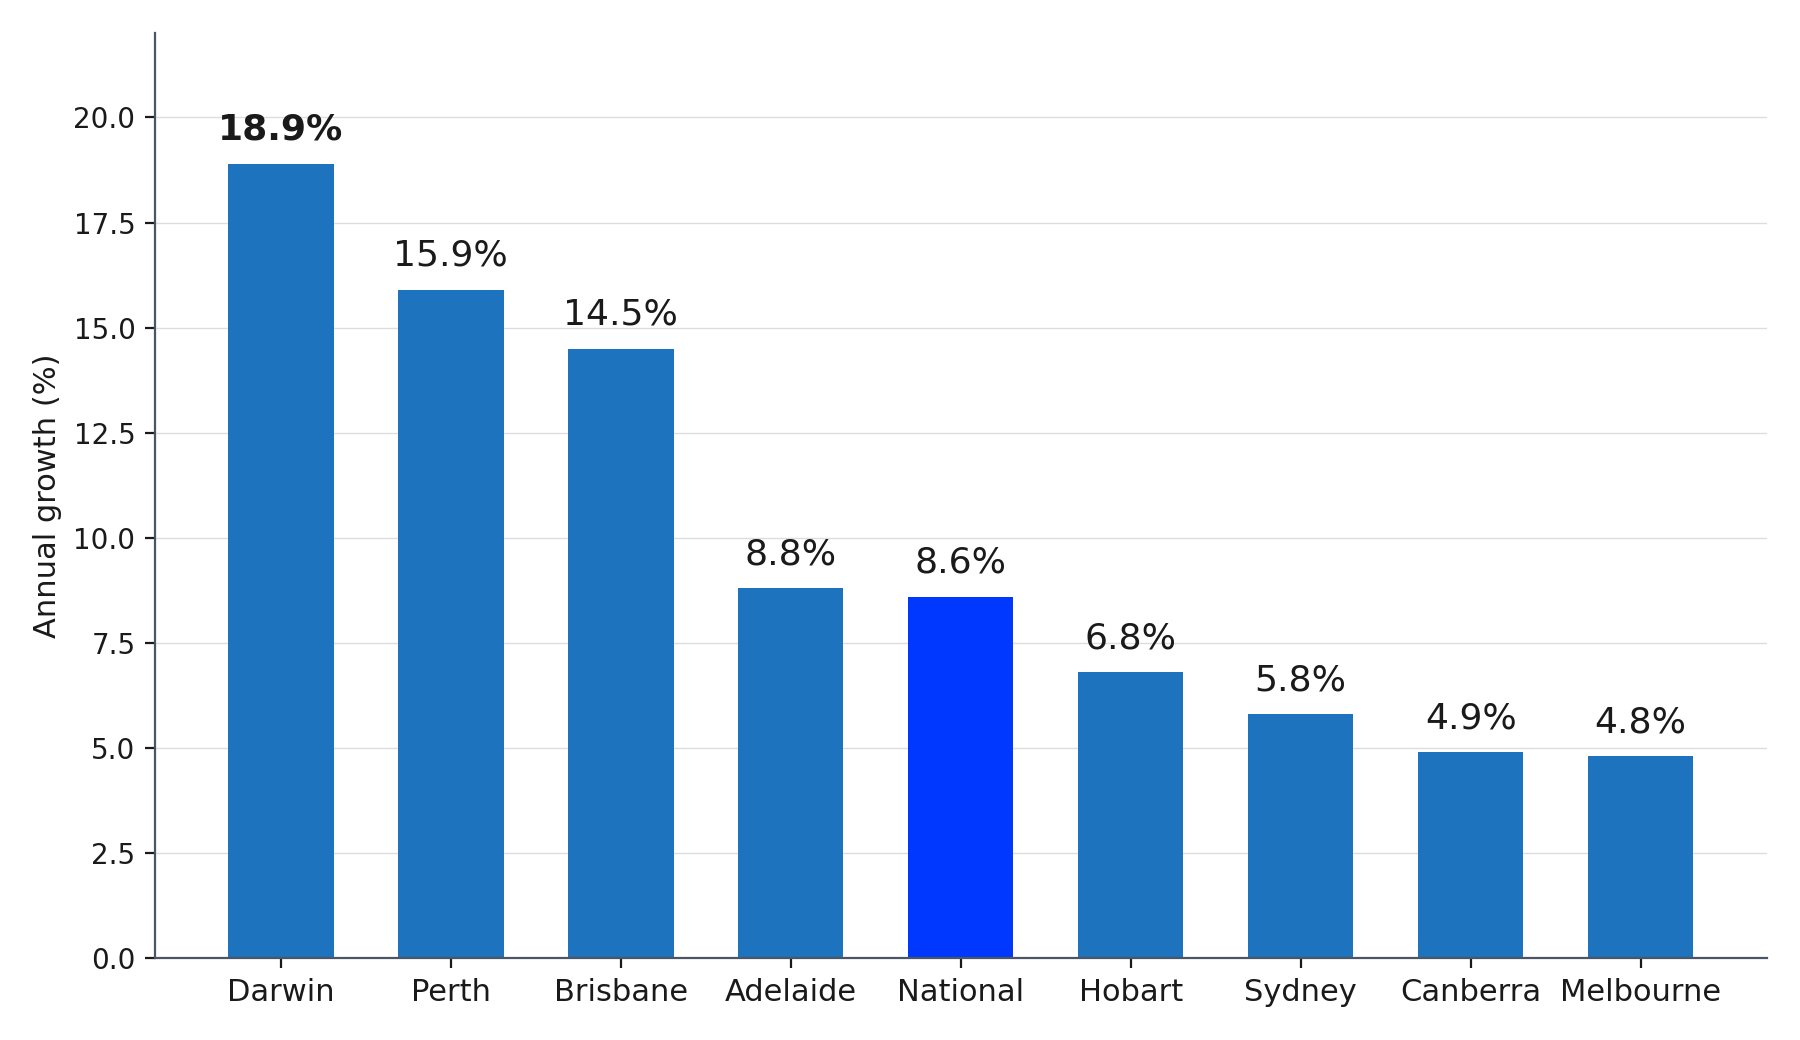
Every property market moves through the same broad stages: a slowdown, a bottom, an upswing and a peak, and different cities can sit in different stages at once. Darwin, Perth and Brisbane posted double digit annual growth through 2025 while Sydney and Melbourne barely moved, simply a different point in the same national cycle.
Annual Dwelling Value Growth by Capital City, 2025
Source: CoreLogic, 2026
Timing an entry matters less than being financially ready when an opportunity appears. Investors who work out how to increase borrowing capacity before a market turns can act while others are still waiting for confirmation.
Population Growth Signals Where Demand Is Heading
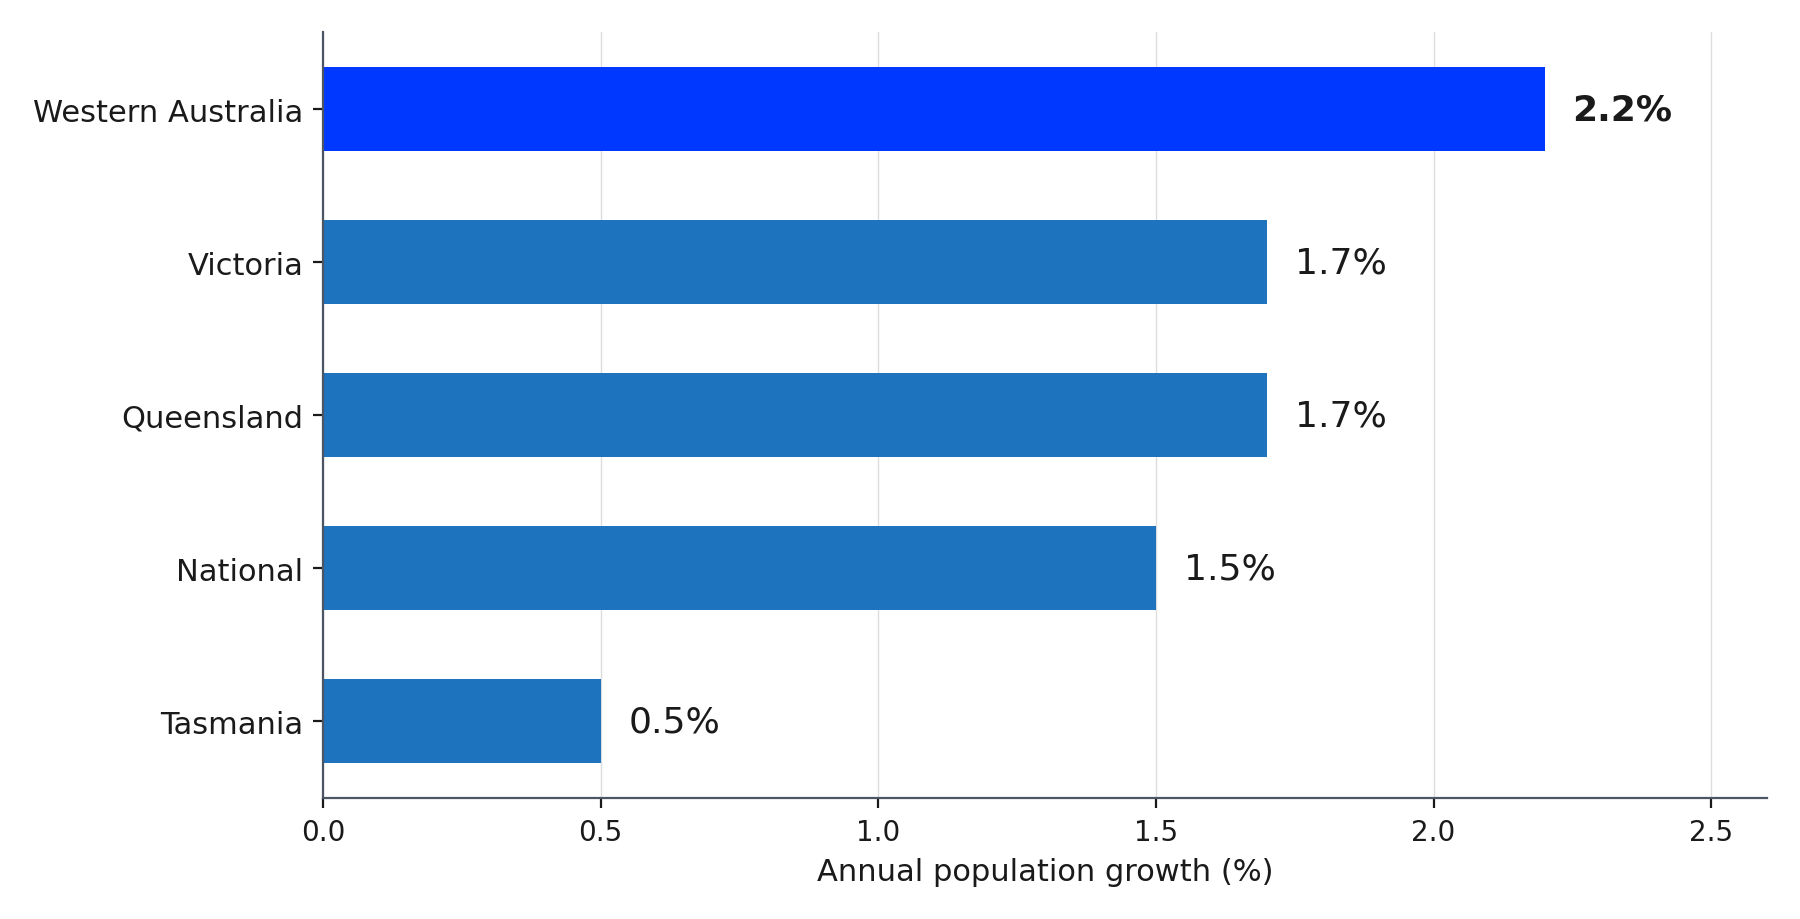
Population growth is one of the most reliable leading indicators in the property market in Australia, since new residents need housing before that demand shows up in median prices. Australia's population grew 1.5 percent to 27.8 million people in the year to December 2025, and Western Australia grew fastest at 2.2 percent, more than four times Tasmania's 0.5 percent.
Population Growth by State, Year to December 2025
Source: Australian Bureau of Statistics, 2025
Fast population growth only becomes a pricing signal once supply cannot keep pace. Reading the housing shortage in Australia alongside migration data gives a clearer picture than either number alone.
Vacancy Rates and the Rental Squeeze
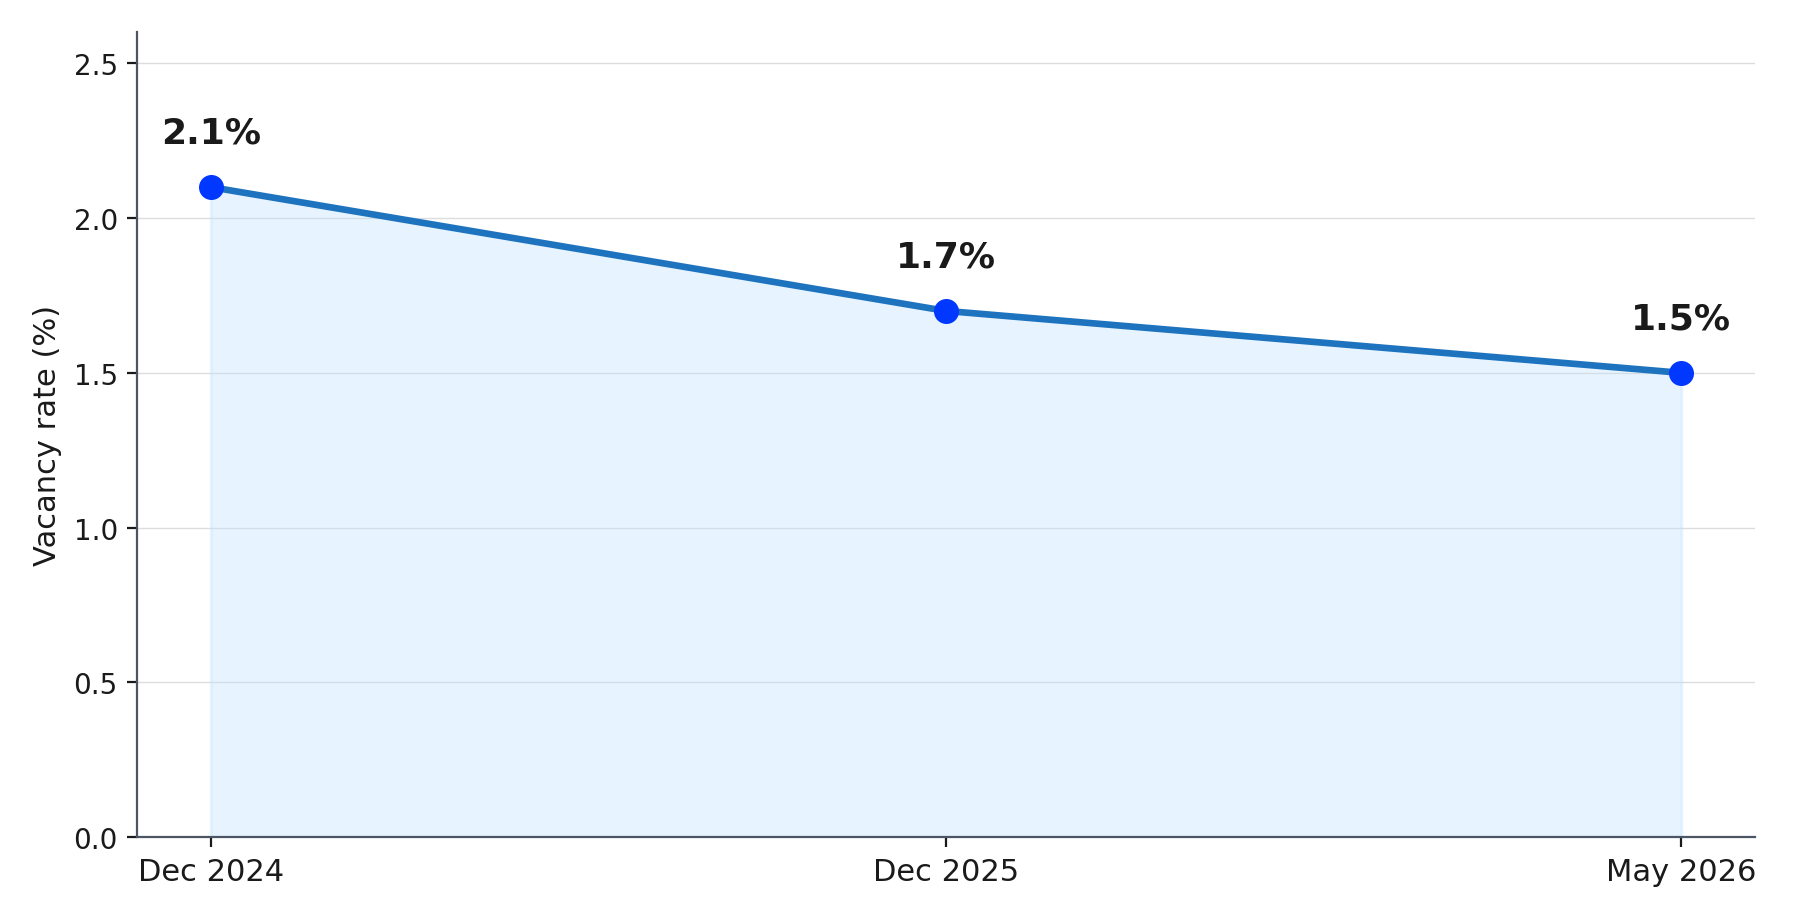
Rental vacancy rates measure how much slack exists in a market, and below roughly two percent tenants compete hard for stock while rents climb quickly. The national rate sat near 1.7 percent at the end of 2025 and tightened to about 1.5 percent by May 2026, one of the tightest readings Australia has recorded in decades.
National Rental Vacancy Rate, 2024 to 2026
Source: CoreLogic, 2026
Tight vacancy is a demand signal, not just a headline about the rental crisis in Australia. Low vacancy suburbs tend to support stronger yields and faster buyer demand later.
How to Turn Market Indicators Into an Investment Decision
No single indicator tells the whole story. Combining population growth, vacancy rates and price momentum gives a far more reliable read than watching any one alone.
Check population growth for the region against the national average.
Check vacancy rates and rental growth for the suburb, not just the city.
Compare recent price growth against the city's five-year average.
Confirm your borrowing position before you shortlist.
Applying this checklist is how investors learn to choose investment grade suburbs instead of guessing from a list everyone already knows.
Final Thoughts
Reading the property market in Australia well is less about predicting the future and more about noticing what has already started to move, since population growth, vacancy rates and infrastructure spending shift before prices do. None of this requires guesswork, just a checklist applied consistently and the discipline to act while a market still looks unremarkable.
Frequently Asked Questions
Recommended Reading
Two pages selected based on what readers of this article are most likely to need next.
Recommended Video
Most investors are still positioned in capital cities — but in 2026, that allocation gap is creating real opportunity cost. In a market where timing, positioning, and yield profiles compound into long-term outcomes, that disconnect matters more than most people realize.