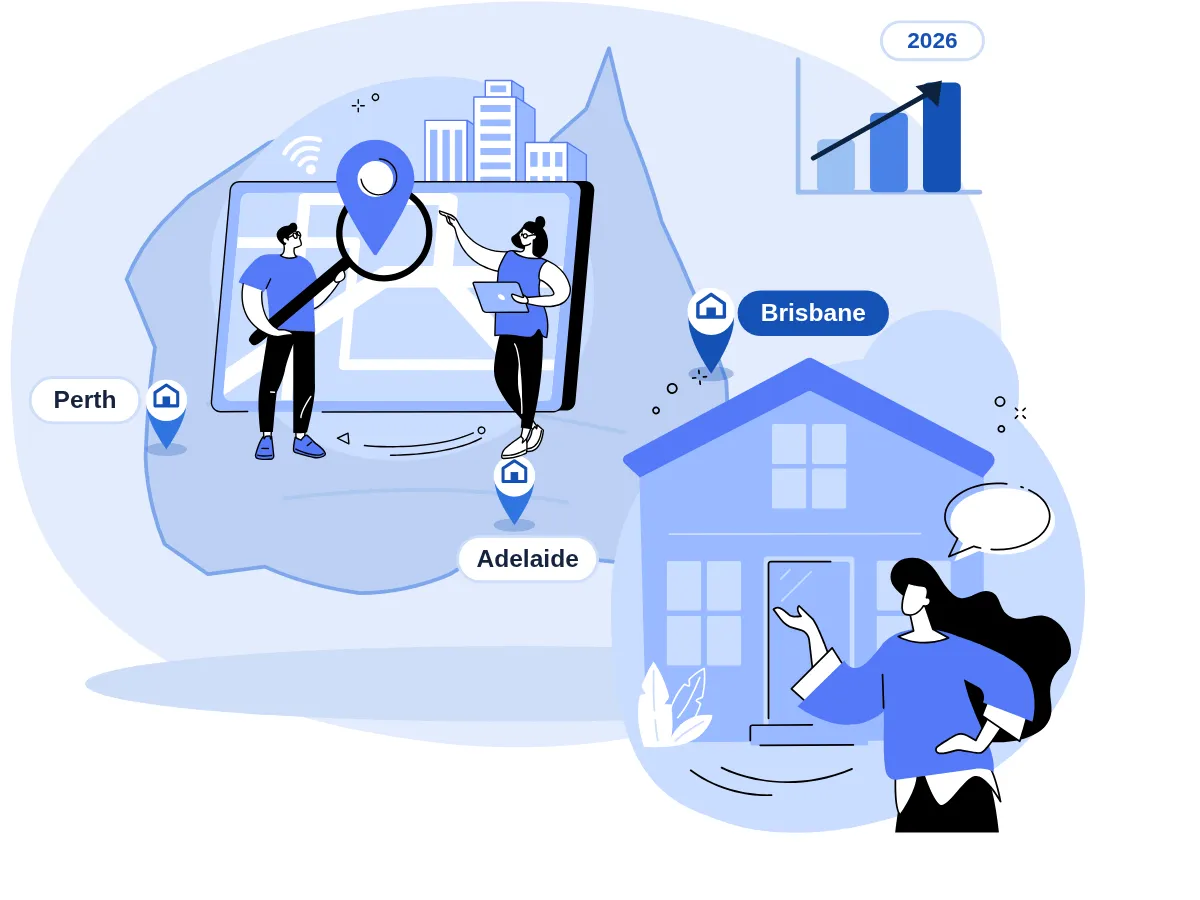
Brisbane vs Adelaide vs Perth: Where Should Property Investors Look in 2026?
Three cities. Three very different investment cases. Brisbane, Adelaide and Perth have each outperformed the national average over the past two years, but they are not interchangeable. The city that makes the most sense for you depends on what you are trying to achieve, not which market has the loudest headlines.
The borrowing capacity formula a lender applies, the rental yield a market delivers, and the entry price your budget can absorb all shape which of these three cities you should actually be looking at. This article breaks them down by the numbers that matter to investors.
How Do Brisbane, Adelaide and Perth Compare for Property Investment?
Before going city by city, here is where each market stands across the four metrics that drive most investment decisions: capital growth, rental yield, median price, and vacancy rate.
2026 Investment Snapshot: Brisbane vs Adelaide vs Perth

Source: CoreLogic, PropTrack, Domain Research, ABS — Q1 2026 data.
Which City Has the Strongest Capital Growth in 2026?
Perth delivered 13.3 per cent capital growth over the 12 months to March 2026. That is the highest of any capital city. A tight supply pipeline, a resources-sector employment base, and sustained interstate migration have all contributed. The issue is that this growth has compressed future upside in premium suburban pockets, and some outer suburbs are doing the heavy lifting.
Adelaide posted 11.4 per cent. The AUKUS defence program is generating employment through at least 2035, and new infrastructure is still in early stages. That sustained demand pipeline is not yet fully reflected in values, which is why Adelaide looks like the more durable growth story over a five to seven year horizon.
Brisbane at 8.2 per cent is the lowest of the three but still well above the national average of 5.1 per cent. The 2032 Olympics is catalysing billions in infrastructure spending concentrated in specific corridors. Investors who understand the debt-to-income ratio australia constraints they face will find Brisbane entry points stretch finance further than Perth's current prices allow.
Capital Growth Trend: Brisbane vs Adelaide vs Perth (2022 to 2026)

Source: CoreLogic Hedonic Home Value Index, PropTrack Market Insight Reports 2022 to 2026.
Where Are Rental Yields Strongest for Investment Properties?
Perth wins on yield and it is not close. Gross rental yields for houses are averaging 5.1 per cent across the metro area, with outer suburbs like Armadale, Midland and Rockingham pushing past 5.8 per cent. For investors prioritising cash flow from day one, Perth makes the strongest case.
Adelaide sits at 4.3 per cent. That is a meaningful yield for a capital city, particularly when rental vacancy is at 0.5 per cent. Northern suburbs like Elizabeth, Salisbury, and Davoren Park are delivering yields above 5 per cent at entry prices still below $500,000.
Brisbane's yield story has weakened as prices have climbed. At 3.8 per cent, a Brisbane investment property is unlikely to be cash-flow neutral without a significant deposit. Inner-city units and select Logan corridor houses offer better yield, but house investors need realistic expectations.
Rental Yield Distribution by Suburb Tier (2026)
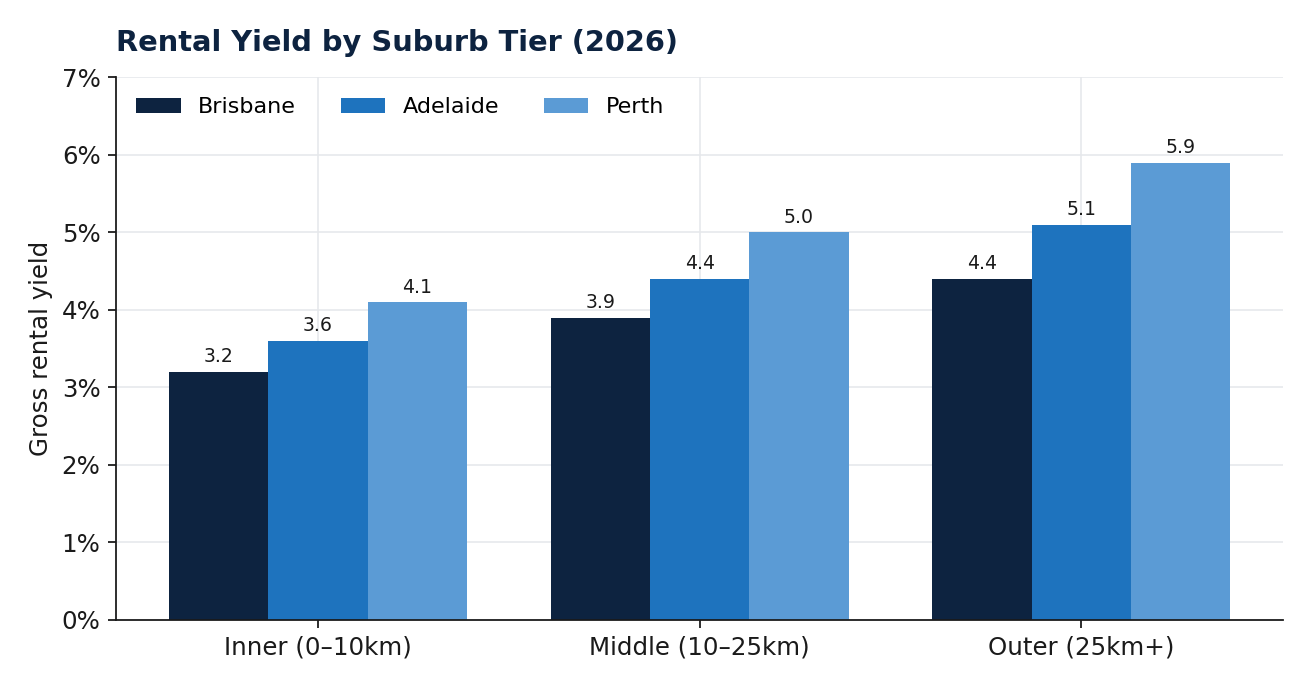
Source: Domain Rental Report Q1 2026, CoreLogic Suburb Profiles.
Which City Is the Most Affordable for First-Time Investors in 2026?
Adelaide is the most accessible of the three. Median house prices sit at $710,000, and investors can find properties in strong rental markets below $500,000. For a first-time investor managing serviceability pressure, that lower entry point translates directly into a better chance of loan approval.
Perth's median of $760,000 is close, but rapid growth has eroded the affordability advantage it held two years ago. The suburbs with the strongest yields are increasingly in the $550,000 to $700,000 range, which still represents value against the eastern states but less so than 2023.
Brisbane is the least affordable. At $850,000, the median is within range of some Melbourne suburbs and requires a larger deposit and stronger serviceability to access. That said, targeted Brisbane suburbs such as parts of Ipswich, Moreton Bay, and select Logan pockets sit well below the median and offer a more accessible entry.
Median Entry Price Range by Investor-Relevant Suburbs (2026)
")
Source: PropTrack Investor Report Q1 2026, CoreLogic suburb data.
For Example
An investor with $100,000 deposit buying in Adelaide at $500,000 (20 per cent deposit) avoids lenders mortgage insurance entirely. The same deposit on a $760,000 Perth property represents 13 per cent, triggering LMI costs of approximately $12,000 to $15,000.
Where Are Vacancy Rates Lowest and Rental Demand Strongest?
All three cities are running well below the 3 per cent vacancy rate considered a balanced market. That means landlords in Brisbane, Adelaide, and Perth all hold strong negotiating positions in 2026. But there are differences worth knowing.
Adelaide's 0.5 per cent vacancy rate is the tightest of the three and one of the lowest of any major capital in Australia. Demand is being driven by interstate migration, international students, and a constrained rental supply pipeline that shows no signs of easing before 2027. The ongoing rental crisis australia is most acute in Adelaide's inner and middle rings.
Perth sits at 0.7 per cent. Strong and consistent. Brisbane at 0.9 per cent is the loosest of the three but still in deeply undersupplied territory.
Residential Vacancy Rate Trend: All Three Cities (2023 to 2026)
")
Source: REIA Vacancy Rate Report, Domain Rental Reports 2023 to 2026.
Which City Best Suits Your Property Investment Strategy?
The honest answer: none of these cities is universally best. The right choice depends on what you need your investment to do.
City-to-Strategy Match: Which Market Fits Your Investment Goal?
Source: FPW Group analysis based on CoreLogic, PropTrack, and ABS data Q1 2026.
Final Thoughts
Brisbane, Adelaide, and Perth are each credible investment markets in 2026. That is actually unusual. Normally one or two cities are running hot while others are flat. The current environment rewards investors who can be specific about what they want their property to do.
For a full breakdown of how these cities fit into the bigger picture, read our complete guide to property investment in Australia.
If cash flow and yield are the priority, Perth makes the strongest case right now. If long-term growth with a more sustainable demand driver is the goal, Adelaide's AUKUS employment pipeline and tight vacancy rate point to durable fundamentals. If the 2032 Olympics is part of your thesis, Brisbane offers genuine corridor opportunities for patient investors who buy early in the right locations.
What none of these markets can do is compensate for buying the wrong property in the right city. Understanding how to increase borrowing capacity and matching market selection to your borrowing position is the step most investors skip.
Frequently Asked Questions
Recommended Reading
Two pages selected based on what readers of this article are most likely to need next.
Watch: The Biggest Property Opportunity in Australia Isn’t in Sydney or Melbourne
In this video, we break down a structural shift in the Australian property market where regional property is quietly outperforming Sydney and Melbourne.