

Bunbury Property Market: Are Units Now the Better Investment?
On the numbers, Bunbury units currently offer the stronger income proposition, but they are not automatically the better investment. They cost roughly $340,000 less to buy and produce a gross yield more than a full percentage point above houses, yet the same dataset shows units taking almost three times longer to find a tenant.
That last figure is the one nobody quotes. Anyone researching Bunbury real estate will find plenty of pages reporting medians and yields, and almost none testing whether the yield advantage survives strata levies, holding costs and real leasing conditions.
Bunbury belongs on the watchlist when you are weighing the best places to invest in property in Australia, but whether it earns a place in your portfolio as a unit or a house comes down to three numbers the suburb profiles leave out.
Bunbury Real Estate in 2026: What the Current Numbers Show
REIWA's Bunbury profile, updated 23 September 2026 and covering the twelve months to August, puts the median house price at $950,000 and the median unit at $610,000. That is a gap of $340,000, or about 36% of the house median.
House sale prices rose 13.1% over that year. Several neighbouring suburbs ran harder still, with Carey Park up 18.6% and College Grove up 18.3%, so Bunbury itself was not the fastest part of its own region.
What it costs to get into each segment
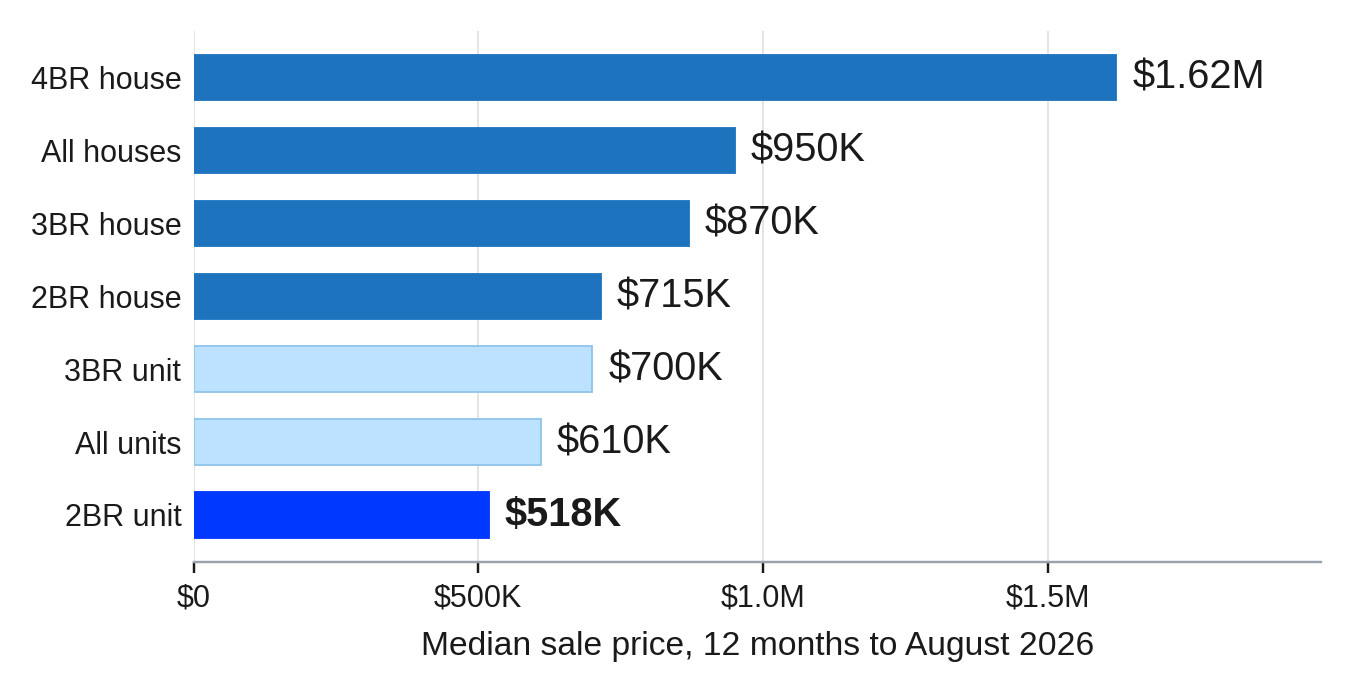
Source: REIWA Bunbury suburb profile, median price data to August 2026.
The spread matters more than the headline. A two-bedroom unit at $518,000 and a four-bedroom house at $1.62 million are not competing purchases, and they will not be assessed the same way by a lender either, which is where your debt to income ratio starts shaping the shortlist before you have inspected anything.
How Bunbury compares with the rest of regional WA
Regional Western Australia has been the strongest broad market in the country. Cotality's index had regional WA up 16.7% over the twelve months to August 2026, with a median dwelling value of $720,940, though the same index recorded a slight 0.2% dip over the final quarter.
Bunbury houses sit well above that regional median and units sit below it. That positioning is worth holding in mind when you compare Bunbury with other regional markets such as Mackay or with the tighter pockets of the Perth rental market.
Source: Cotality Home Value Index, August 2026 results.
Bunbury Houses vs Units: Which Is Performing Better?
This is where the two segments genuinely separate, and where most Bunbury market pages stop reporting.
Rental yields on Bunbury houses and units
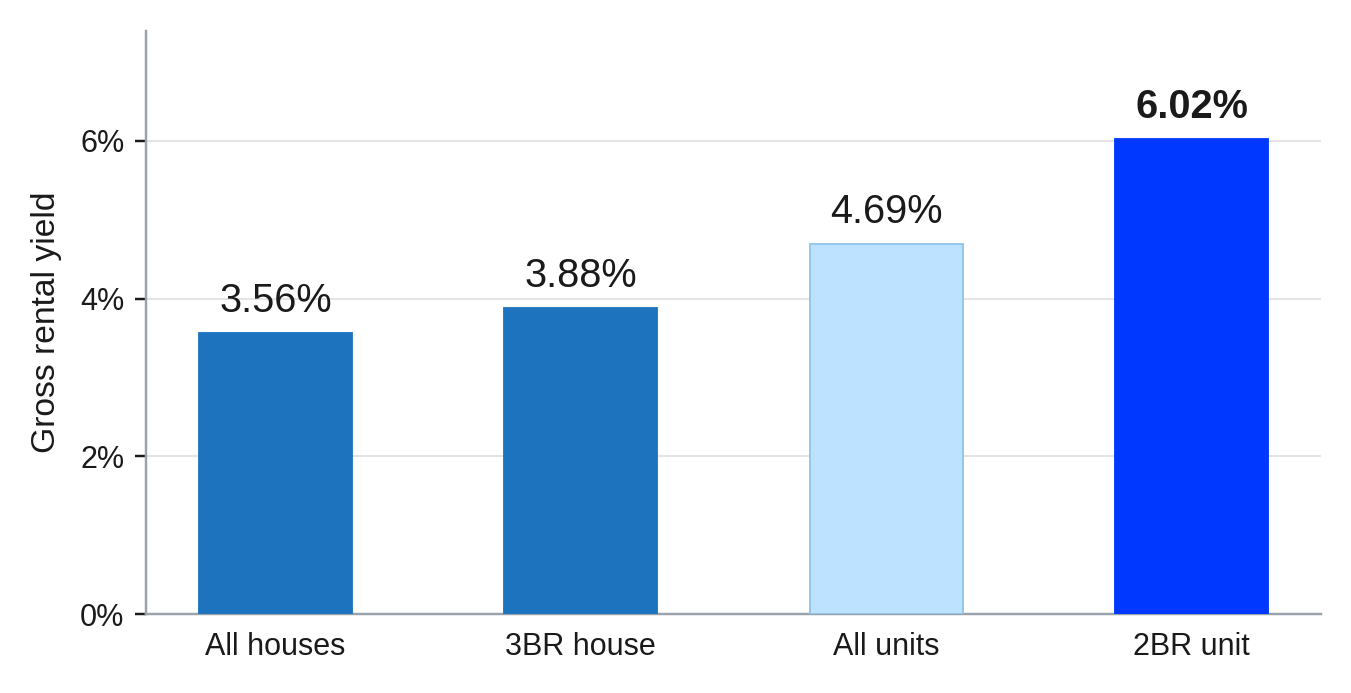
Source: FPW Group calculations using REIWA Bunbury median prices and rents, August 2026.
The arithmetic is simple. A $950,000 house renting at $650 a week produces $33,800 a year, or 3.56% gross. A $610,000 unit renting at $550 a week produces $28,600, or 4.69%.
That difference is exactly the yield versus growth trade-off in miniature. The cheaper asset carries the income. The question is what it gives up to get there.
How long each takes to sell, and how long to lease
Source: FPW Group calculations using REIWA Bunbury median prices and rents, August 2026.
The arithmetic is simple. A $950,000 house renting at $650 a week produces $33,800 a year, or 3.56% gross. A $610,000 unit renting at $550 a week produces $28,600, or 4.69%.
That difference is exactly the yield versus growth trade-off in miniature. The cheaper asset carries the income. The question is what it gives up to get there.
How long each takes to sell, and how long to lease
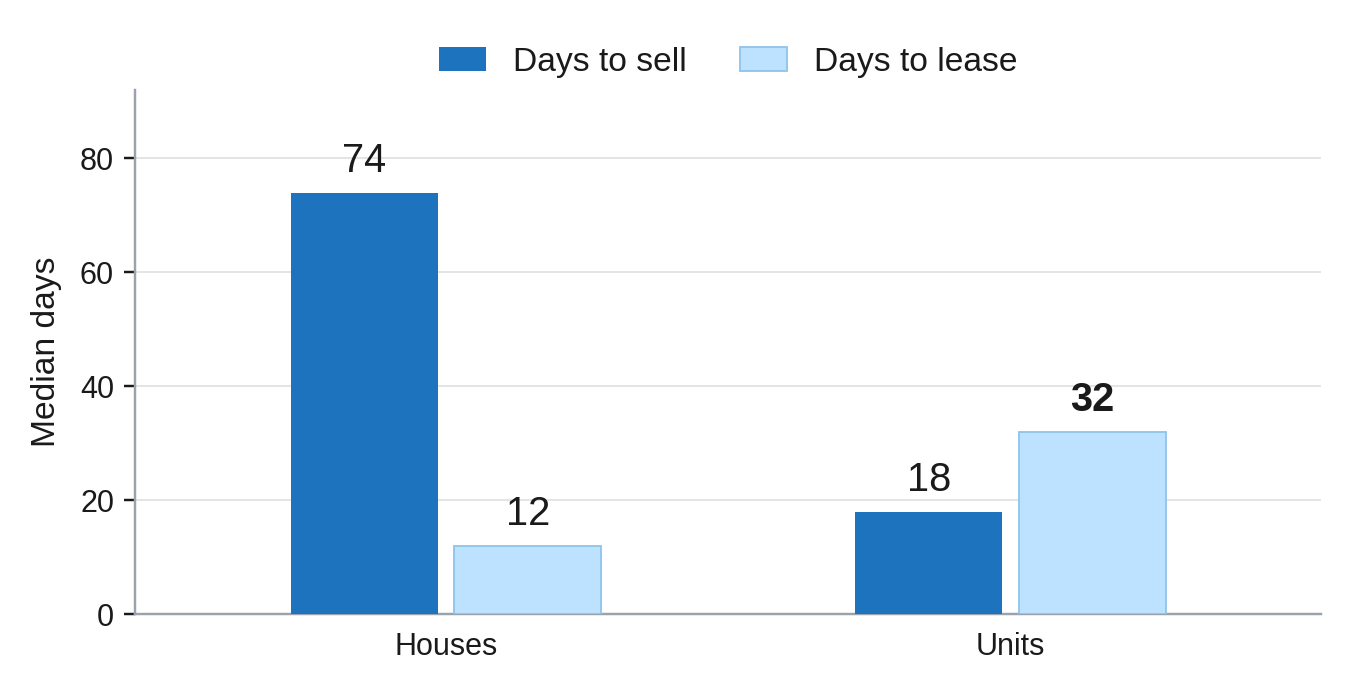
Source: REIWA Bunbury suburb profile, settled sales and reported leases as at 23 September 2026.
This is the finding that complicates the easy conclusion. Investors buying units are competing hard enough to clear stock in 18 days, while the tenants who are supposed to fund those purchases are taking 32 days to turn up.
A 20-day gap in leasing time is roughly three weeks of lost rent on every vacancy. It is also a reminder that a tight regional vacancy rate is a district average, and a low vacancy rate can be a warning as easily as a good sign depending on which building you are standing in.

Is Bunbury's Unit Advantage Sustainable?
What could support further demand
REIWA's 2026 forecast update flagged the Bunbury regional centre for potential median house price growth of 15% to 20% over the year, placing it in the stronger tier of WA regional markets. Rising house prices push more buyers down into unit stock, which supports unit prices from below.
Rental supply is still constrained. REIWA's regional data had Bunbury vacancy at 1.6% in August 2026, down from 2.0% in July, against the 2.5% to 3.5% band REIWA treats as a broadly balanced market.
What could put pressure on Bunbury unit prices
Rents are not keeping pace. Bunbury's median house sale price grew 13.1% over the year while median house rent growth registered 0.0%. When prices climb and rents sit still, yields compress, and the income case that attracted investors weakens with every further price rise.
Financing is the other pressure point. Regional unit stock is often valued conservatively and can attract tighter lending terms, and interest rates feed into house prices faster in markets where buyers are stretched on serviceability rather than deposit.
What Investors Should Check Before Buying a Bunbury Unit
Strata costs turn a gross yield into something smaller
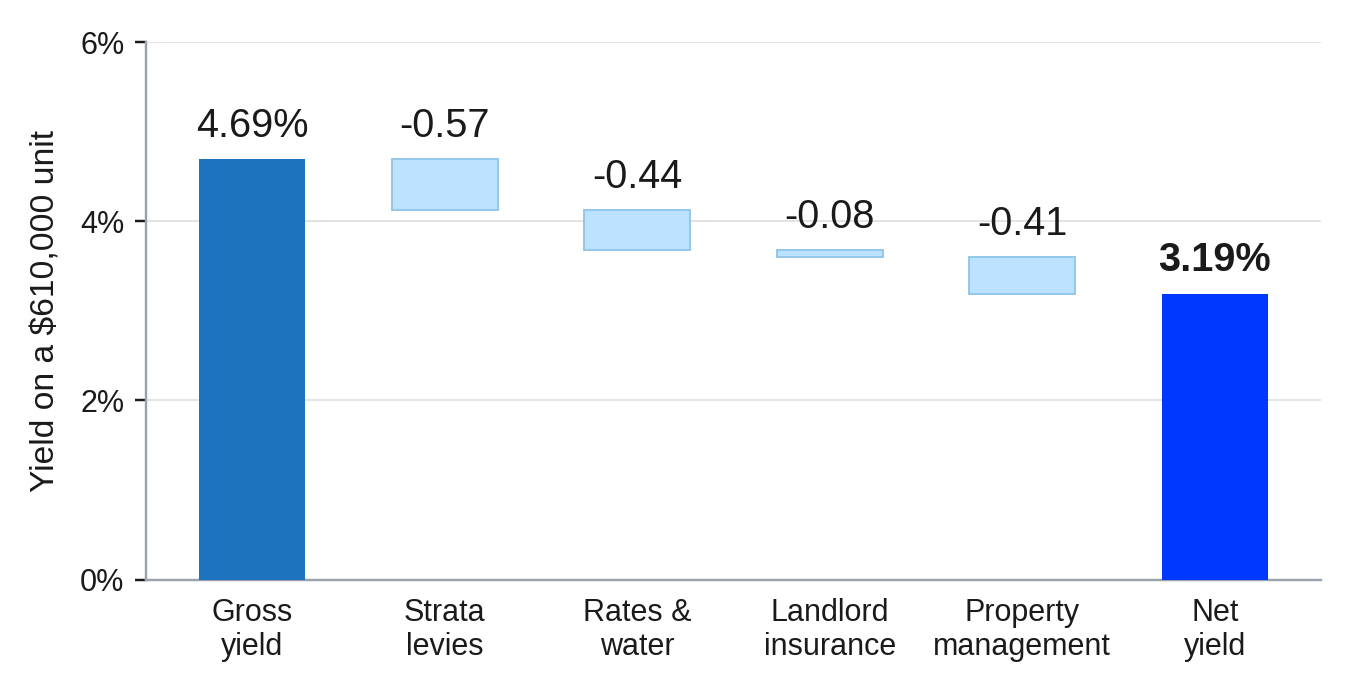
Source: FPW Group modelling using REIWA Bunbury median price and rent, August 2026, with indicative holding costs.
Run the same exercise on the house and it lands near 2.83% net, because there is no strata bill even though rates and management still apply. The unit advantage survives, but it narrows from 1.13 percentage points gross to roughly 0.36 points net.
That is a materially different investment case from the one the portals imply. Before you commit, get the strata report, check the sinking fund balance and ask about any special levy under discussion, then confirm with a mortgage broker how lenders treat that particular complex.
Which Bunbury unit configurations show the strongest numbers
Two-bedroom units are the standout on paper. A $518,000 median against $600 a week calculates to roughly 6.02% gross, well ahead of the all-unit figure.
Three-bedroom units look better still on REIWA's numbers, at a $700,000 median against a $937 weekly rent, but treat that with real caution. Rents that high in a regional unit market usually point to a very small sample, and REIWA notes its suburb data is drawn from Landgate transactions and revised as more settle.
So, Are Units Now the Better Investment in Bunbury?
What the data supports
Units are cheaper to enter by $340,000, produce a higher gross and net yield, and clear the market in 18 days against 74 for houses. For an investor whose constraint is borrowing capacity or cash flow, that is a real and measurable advantage.
What the data does not tell you
It does not tell you the strata position of any specific complex, the age and condition of the building, what is being approved for construction nearby, or how a lender will value that stock. It also does not resolve the leasing gap, which is the single most awkward number in the dataset.
Houses still carry the land component, and land is what has historically driven long-run growth in regional markets. A 13.1% annual gain on the house median against a flat rent line is a growth story, not an income one. They are different jobs in a portfolio.
Final Thoughts
Bunbury real estate now splits cleanly into two different propositions. Units offer a lower entry price and a stronger income yield. Houses offer the land component and the growth record.
The data leans toward units for income investors, with one significant caveat: they take nearly three times longer to lease than houses, and the yield advantage shrinks to about a third of a percentage point once strata and holding costs are counted.
So, treat the medians as a starting position rather than an answer. Pull the strata report, check recent comparable leases in the specific building, confirm what your lender will do with that stock, and then decide whether the individual property justifies the price against the alternatives open to you.
Frequently Asked Questions

Recommended Reading
Two pages selected based on what readers of this article are most likely to need next.
Recommended Video
Most investors are still positioned in capital cities — but in 2026, that allocation gap is creating real opportunity cost. In a market where timing, positioning, and yield profiles compound into long-term outcomes, that disconnect matters more than most people realize.