
Brisbane Property Market: How the 2032 Olympics Will Shape Investment Growth
The Brisbane property market has outperformed every major Australian capital for five years running. But the story has shifted. Affordability alone no longer explains what is happening.
The 2032 Olympics is now the structural catalyst reshaping which corridors attract capital, which suburbs get the infrastructure, and how the next decade of Southeast Queensland growth unfolds. Getting the corridor call right is the difference between a strong position and an expensive lesson in choosing the right suburb.
Where the Brisbane Property Market Stands in 2026
Brisbane's median house price crossed $990,000 in early 2026, according to CoreLogic data. That is a rise of more than 70% from $560,000 in 2019. Most of that growth was structural, not speculative.
Interstate migration, a deepening housing shortage, and a committed infrastructure pipeline created compounding demand that Sydney and Melbourne could not absorb. The vacancy rate in most inner Brisbane suburbs sits under 1%. New supply continues to fall short.
Borrowing Power Before and After APRA's 3% Buffer
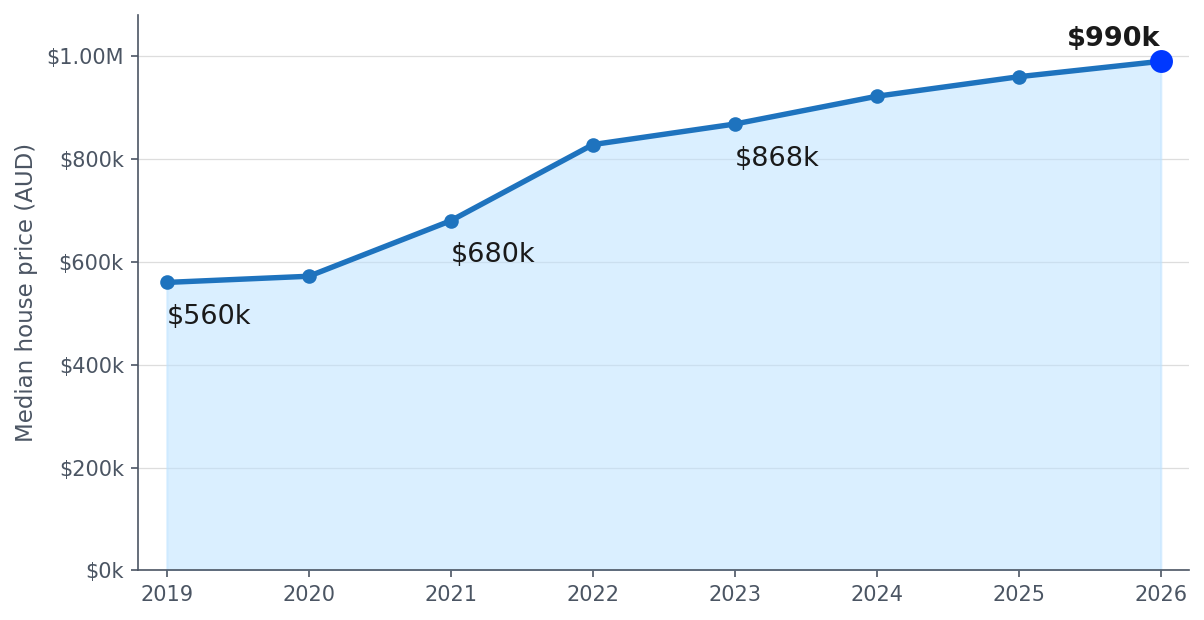
Source: CoreLogic, 2026
Investors entering in 2026 are not riding the 2021 wave. The market has matured. But the Olympic timeline from now to 2032 means significant capital is still being deployed at the corridor level, and premiums in key zones are still forming.
How Olympic Infrastructure Is Driving Corridor Transformation
The 2032 Brisbane Olympics is not a single stadium event. It is a 14-venue, multi-corridor infrastructure programme spanning the Sunshine Coast to the Gold Coast. The Queensland Government has committed over $7.1 billion in direct venue and precinct funding. Total investment across transport, accommodation, and public works exceeds $15 billion.
Most investors focus on the venues. The smarter lens is the transport overlay.
The Cross River Rail project, Brisbane Metro expansion, and Sunshine Coast rail link are permanent assets. They reshape the accessibility equation for previously undervalued suburbs in ways that outlast any Olympic demand spike by decades. These upgrades also interact directly with capital growth dynamics at the suburb level.
2032 Olympic Infrastructure Investment by Category
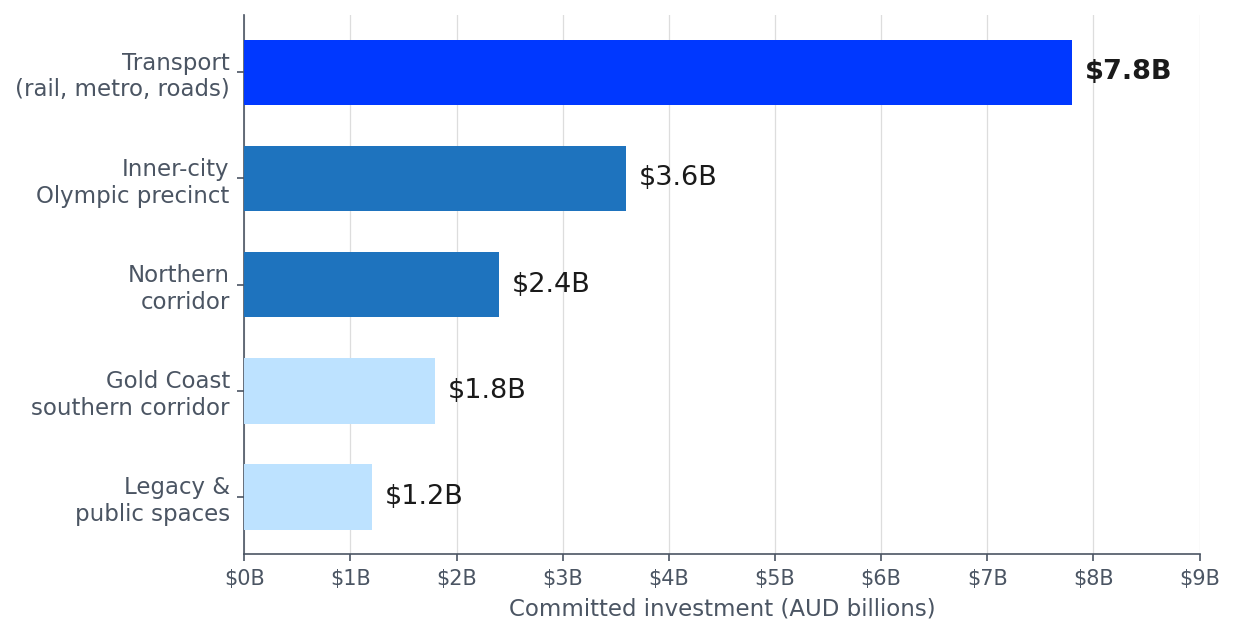
Source: Queensland Government, 2026
FOR EXAMPLE
A suburb 25km north of Brisbane's CBD that currently takes 45 minutes by bus will take 22 minutes by rail after 2028. That single accessibility change typically adds 15 to 25% to a suburb's price floor, independent of any Olympic demand spike. The infrastructure arrives before the Games and stays long after. Map suburb selection against the infrastructure completion timeline, not the event date.
The Key Brisbane Growth Corridors to Know
Not all corridors carry equal opportunity. Three zones stand out based on infrastructure spend, accessibility improvement, and current valuation relative to their trajectory.
Inner-City Olympic Precinct
Woolloongabba, Fortitude Valley, and New Farm sit at the centre of the Olympic precinct. These suburbs already carry a premium. Rental demand from athletes, officials, and event tourism will sustain yield performance through the mid-2030s. This is a positioning and yield play, not an entry-price opportunity. First-time investors should read up on common property investment mistakes before committing to this zone.
Northern Corridor
This is where affordability and infrastructure genuinely intersect right now. The stretch from Moreton Bay through Caboolture toward the Sunshine Coast combines accessible entry prices with significant transport upgrades. For investors comparing options across capitals, the Brisbane, Adelaide, and Perth analysis shows the northern corridor's affordability-to-infrastructure ratio as one of the strongest in any capital city market right now.
Southern Corridor (Gold Coast)
Gold Coast venues put the city directly on the Olympic map. Broadbeach, Southport, and the northern Gold Coast have recorded strong price growth. Long-term yield is supported by permanent tourism infrastructure that predates the Olympics and will outlast it. This is not purely an event play.
How Brisbane Compares to Other Australian Capitals
Brisbane's structural advantage comes down to three things running at once: population growth, land constraints, and infrastructure commitment in a city still affordable relative to Sydney. The median house price gap between the two cities remains over $400,000 despite Brisbane's recent surge.
Five-Year Capital Growth by Australian Capital City
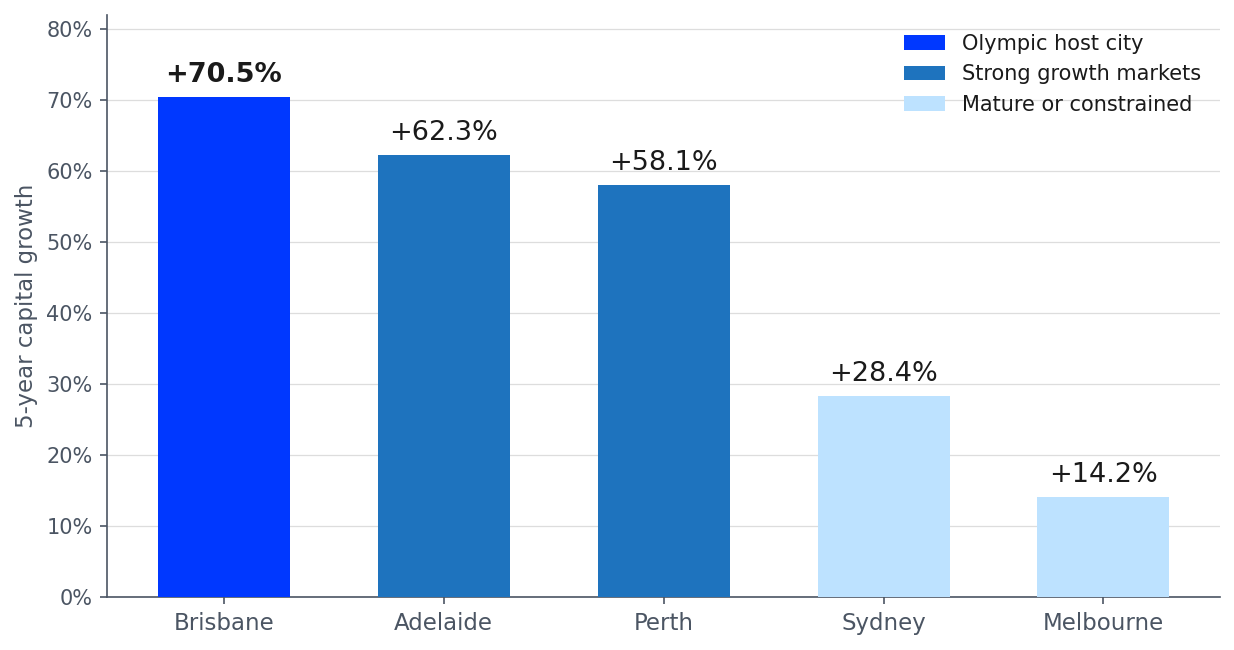
Source: CoreLogic, 2026
ABS regional population projections show Southeast Queensland adding around 90,000 residents per year between 2026 and 2036. That is not event tourism. It is structural migration driven by affordability and employment.
Compare that to Melbourne, where apartment oversupply has suppressed inner-ring growth, and Sydney, where serviceability pressure has shrunk the buyer pool. Brisbane is taking on investors both markets have effectively priced out. The scale of accidental investment activity migrating into Southeast Queensland reflects that shift directly.
Risk Factors and Overvaluation Zones to Watch
Olympic Premium Fatigue
Properties marketed as Olympic investment properties in 2025 and 2026 carry premiums that may compress after the Games. Athens in 2004 and Rio in 2016 both showed venue-adjacent property declines of 20 to 35% within two years of the respective events.
Brisbane's diversified multi-corridor model reduces concentration risk, but single-suburb exposure near specific Olympic venues warrants real caution.
Apartment Oversupply in Some Corridors
Developers have launched significant unit volumes in Brisbane's inner suburbs and the Gold Coast in anticipation of Olympic-period demand. A yield versus growth strategy in those zones requires close analysis of settlement timelines and vacancy risk. Not all apartments in Olympic-adjacent corridors will perform the same way.
Serviceability Pressure at This Price Point
Brisbane's $990,000 median is a fundamentally different market from where it was at $560,000. Understanding how lenders assess borrowing capacity is now a core part of the Brisbane investment calculation. The 3% serviceability buffer applied by lenders, set by APRA, means buyers need substantially higher income than they did in 2021.
For many investors, this is where the maths stops feeling theoretical. A portfolio that looked scalable in 2021 now has different constraints. That is not a reason to avoid Brisbane. It is a reason to enter with a clean finance structure and a clear corridor rationale.
Final Thoughts
Brisbane's structural story is intact. Population is growing, vacancy is tight, and $15 billion in infrastructure is being permanently embedded into the corridor network.
Frequently Asked Questions
Recommended Reading
Two pages selected based on what readers of this article are most likely to need next.
Recommended Video
Most investors are still positioned in capital cities — but in 2026, that allocation gap is creating real opportunity cost. In a market where timing, positioning, and yield profiles compound into long-term outcomes, that disconnect matters more than most people realize.