

The Property Investment Metrics That Can Make or Break a Decision
Introduction
No single investment property metric can tell you whether a property is a good buy. The real signal comes from how financial, rental, growth and risk metrics line up together, or fail to, and from whether affordability, demand and growth all point the same direction at once.
Most investors default to one headline number. Rental yield looks strong, so the property seems safe. Capital growth history looks good, so the suburb seems proven. But a property can pass one test and quietly fail three others.
That gap between a single good number and a genuinely sound decision is where most avoidable losses happen. It shows up when a property looks affordable until the real holding costs land, or when a suburb's vacancy rate looks tight until you check what is being built nearby.
Why the Numbers Behind an Investment Property Matter
Australian investors now have more property data than ever, with yield, vacancy and price history available on demand.
Interpretation is the issue. A property can show a healthy yield and a rising vacancy rate at once, and more data just gives investors more numbers to misread in isolation.
The practical fix is a small set of questions applied every time. Can you afford to hold the property through a rate rise or a vacancy. Will it produce income that holds up under real demand. Is there a credible path to growth. And what would make this decision wrong.
Every metric in this article maps to one of those four questions. Treated separately, metrics create noise. Treated as answers to those questions, they form a decision.
The Financial Metrics That Decide Whether You Can Hold an Investment Property
Borrowing capacity is a ceiling, not a quality signal
Borrowing capacity tells a lender how much they will lend you, not whether the property is a sound investment. Understanding your borrowing capacity formula matters because most of the gap between your income and your limit comes from policy settings, not your finances.
Debt to income ratio and serviceability set the real limits
Your debt to income ratio becomes the binding constraint once you own more than one property, since APRA allows banks to write only 20 per cent of new lending above a ratio of six times income (APRA, 28 May 2026). On top of that, APRA's serviceability buffer tests every new loan at your rate plus three percentage points, so a loan priced at six per cent is assessed as though it costs nine. Two investors on the same income can be offered very different amounts as a result. Reviewing your mortgage serviceability position before you shortlist properties avoids finding this out at approval stage.
Cash flow is what the yield number does not show you
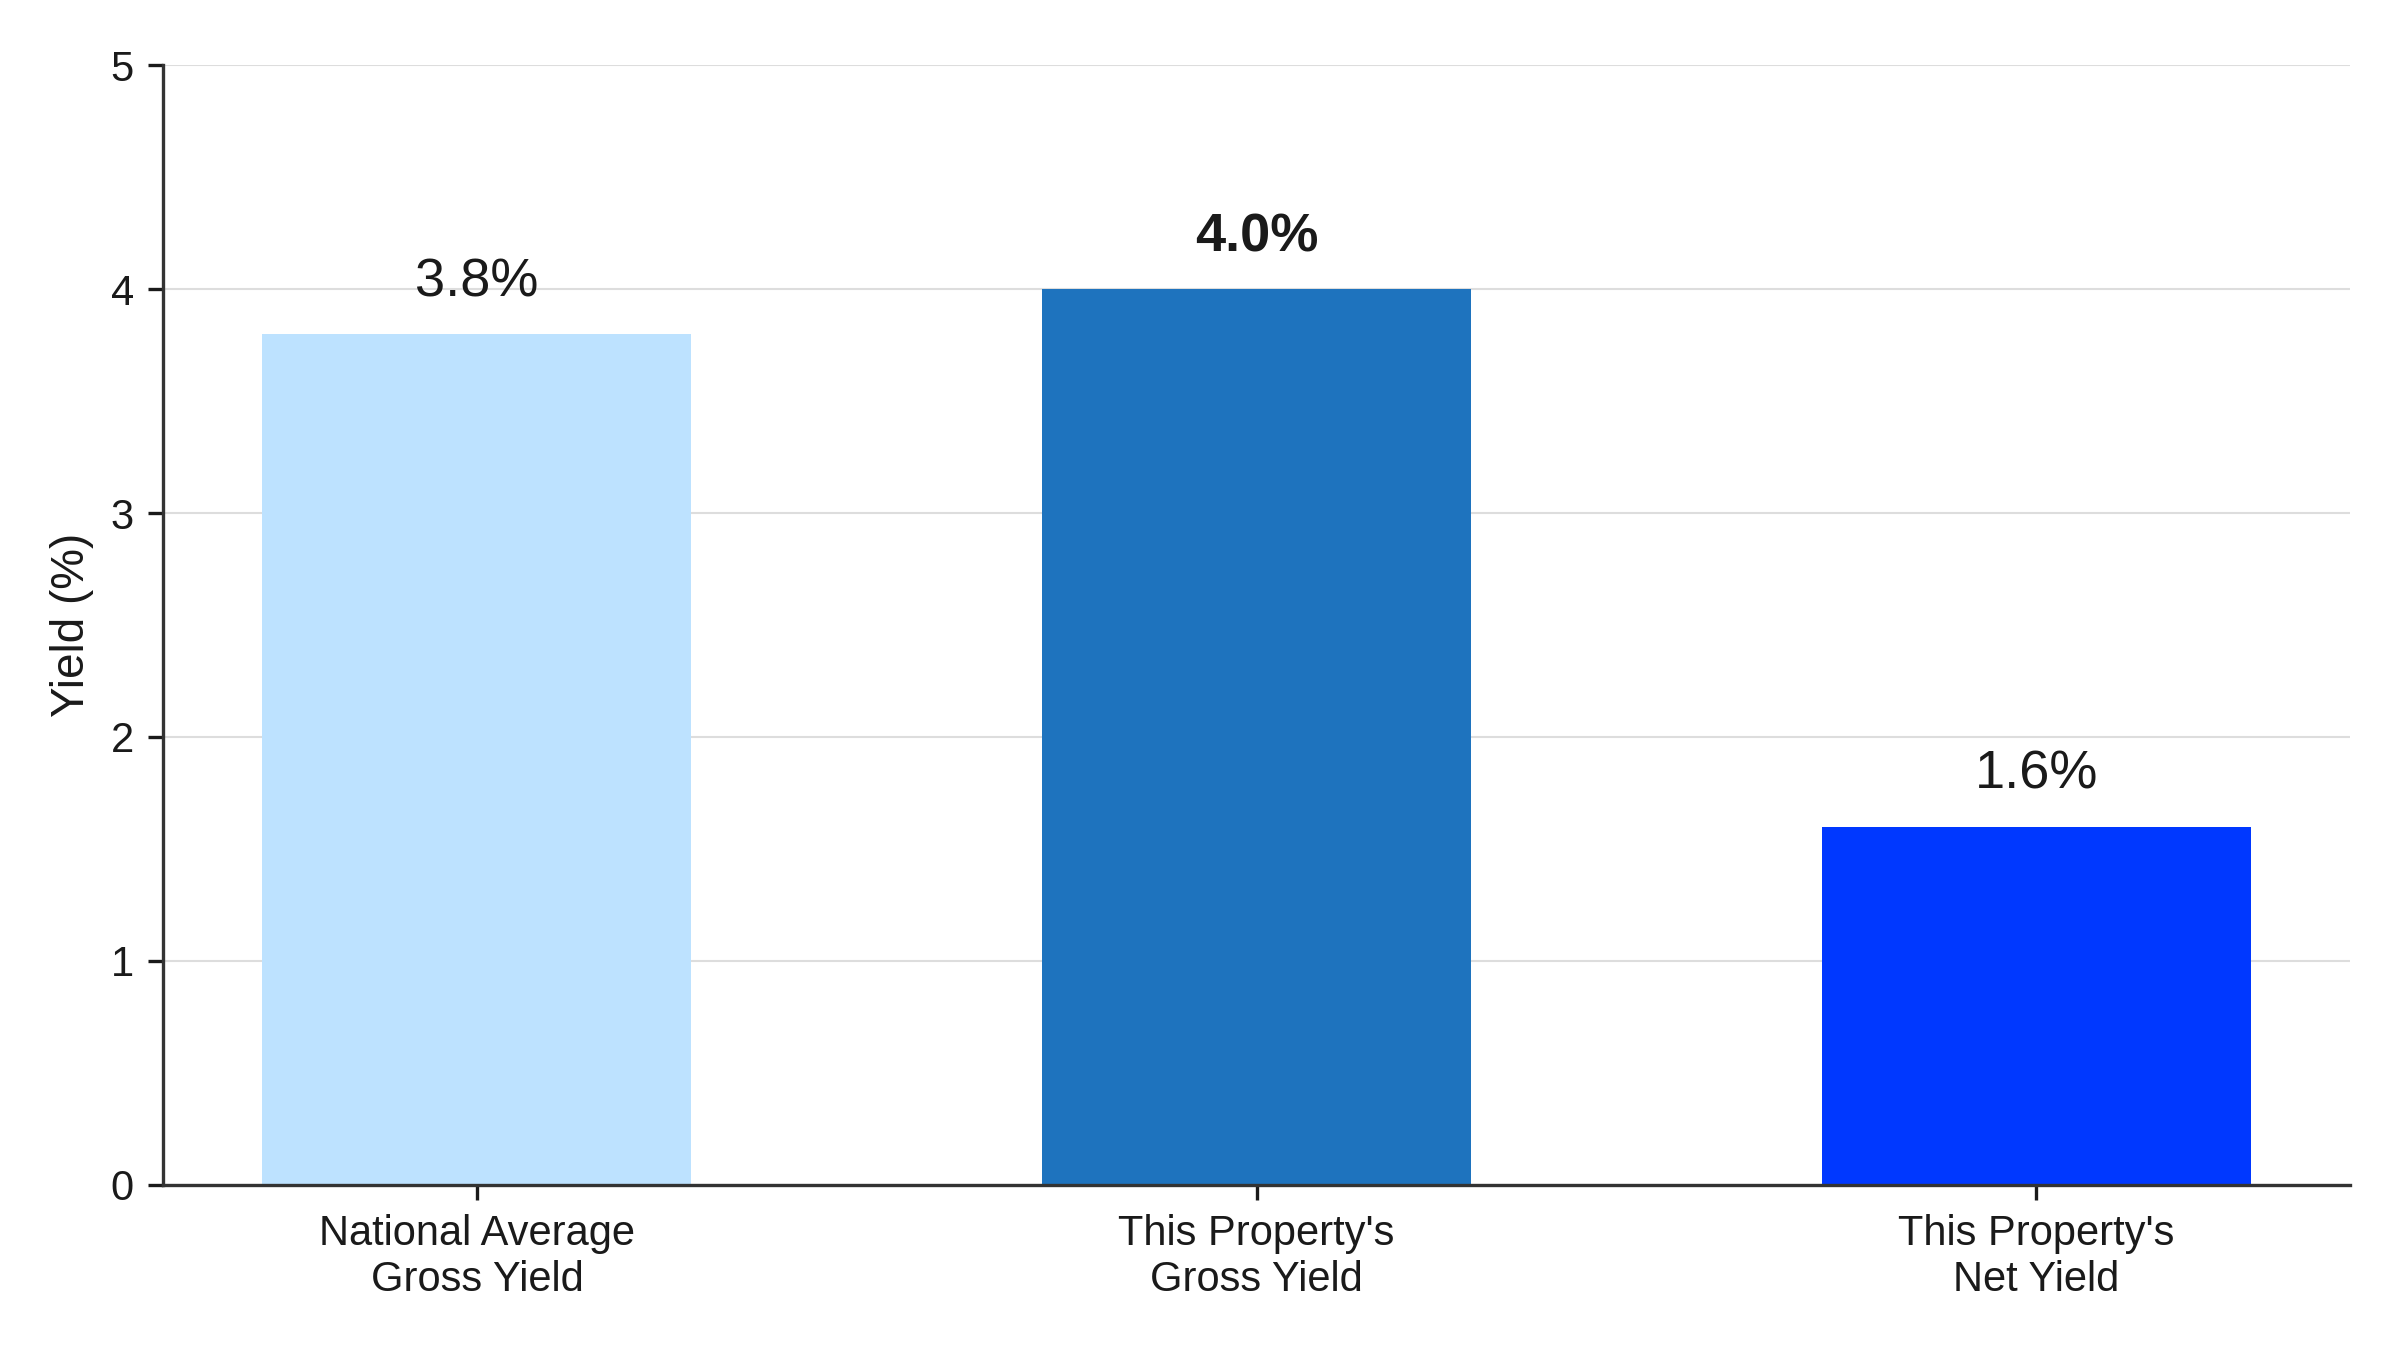
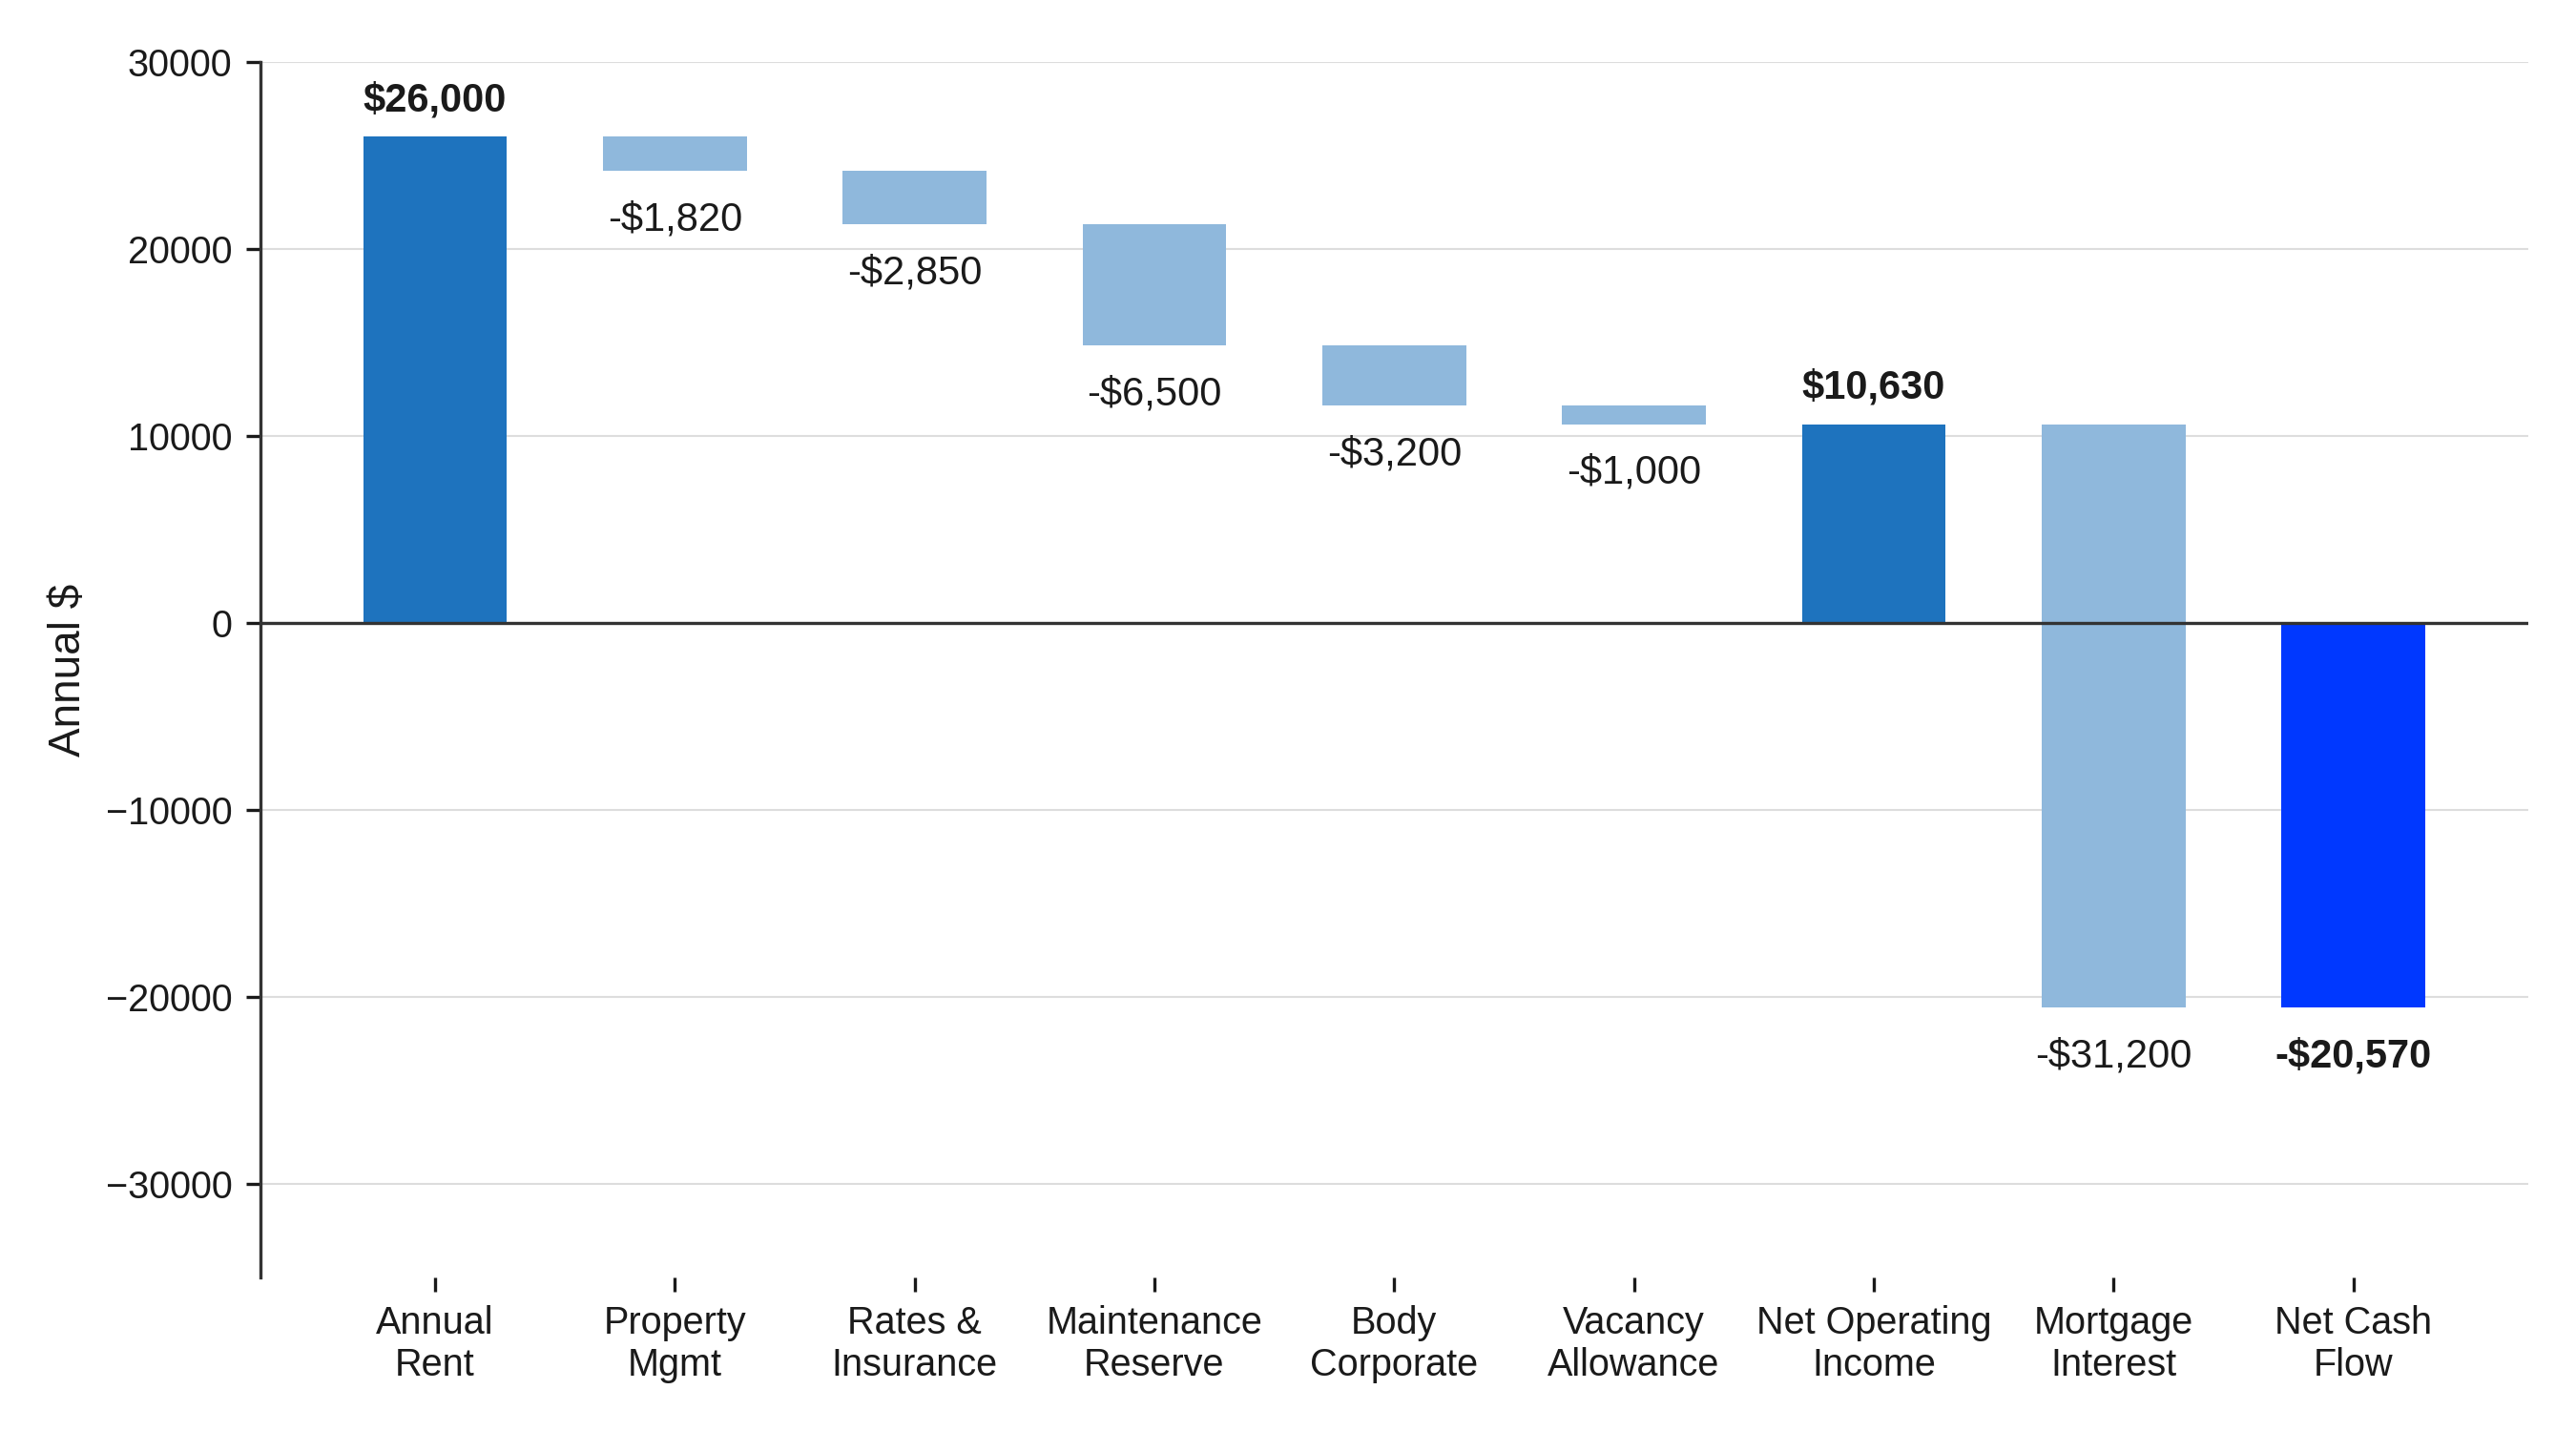
Gross rental yield ignores every cost of holding the property. Net cash flow accounts for management fees, rates, insurance, a maintenance reserve and a realistic vacancy allowance, and two properties with the same headline yield can produce very different real returns once those costs are applied.
What an Advertised Yield Leaves Out
Source: Cotality, March 2026
The Rental and Demand Metrics That Reveal Real Income Potential
Rental yield tells you about price, not demand
Rental yield is a function of price and rent, not of how many tenants want the property. National gross yield on combined dwellings sat at 3.8 per cent in August 2026, ranging from around 3.3 per cent in Sydney to 6.3 per cent in Darwin (Cotality, August 2026). A high yield in a low demand location usually reflects a price the market has already adjusted for growth risk.
Vacancy rates need a supply check, not just a snapshot
National rental vacancy sat at 1.7 per cent in early 2026, well below the 2.5 per cent decade average treated as a balanced market (Cotality, May 2026). That figure only stays landlord-friendly if new supply does not catch up with demand. Reading whether a low vacancy rate is a good sign or a warning depends on what is approved and under construction nearby, not the vacancy figure alone.

Rental growth and days on market show the trend behind the number
Annual rent growth across the combined capitals reached 5.7 per cent, up from 3.4 per cent a year earlier (Cotality, 2026). A suburb with accelerating rental growth is a different proposition to one where rents have already run hard, even at an identical yield. Days on market adds a liquidity signal: a listing that leases quickly points to genuine demand rather than a landlord discounting rent to fill a vacancy.
The Capital Growth and Supply Metrics That Shape the Long Game
Historical growth is evidence, not a forecast
A suburb's five or ten year growth record shows what happened under a specific set of past conditions. Interest rates, population flows and planning settings shift over time and are not guaranteed to repeat. Use historical growth to understand behaviour under stress, not to project forward in a straight line.
Prices, population and infrastructure carry more weight than a spike
A rising median shows the market is moving, not whether your specific property is well priced within it. Broader analysis of where individual capital city markets are heading is more useful than the median alone. Over a ten year hold, population growth, job creation and confirmed infrastructure investment tend to matter more than a strong quarter of price growth. FPW's review of how infrastructure projects move property prices found that confirmed, funded projects move prices differently to projects that are merely announced.
Gross Yield Compared With Real Net Return
Source: Cotality, March and August 2026
Reading a Suburb Profile Without Being Misled by One Ranking
A profile is a starting point, and one ranking can hide a lot
Learning how to read a suburb profile properly means treating median price, growth and vacancy as starting questions, not a final answer. A suburb ranked highly for growth can mix established houses with new apartment stock performing very differently, and a ranking built on the median hides that split.

Comparing suburbs properly means using the same metric set every time
Set the same four to five metrics, vacancy, rental growth, five year growth, planned supply and price point, and apply them to every suburb on your shortlist. This is the same logic behind FPW's broader approach to property investment analysis across every market we assess.

What Happens When Property Investment Metrics Conflict
This is where most surface-level guides stop and where the real analysis starts.
High rental yield, weak population growth
A high yield in a location with flat or declining population growth is usually the market pricing in limited upside. It is not a bonus sitting on top of a normal growth profile.
Strong capital growth, poor cash flow
A property that has grown well can still be difficult to hold if rental income does not cover a realistic share of costs. Strong past growth does not refinance a shortfall, and drawing on it depends on market timing you do not control.
Low vacancy, rising new supply
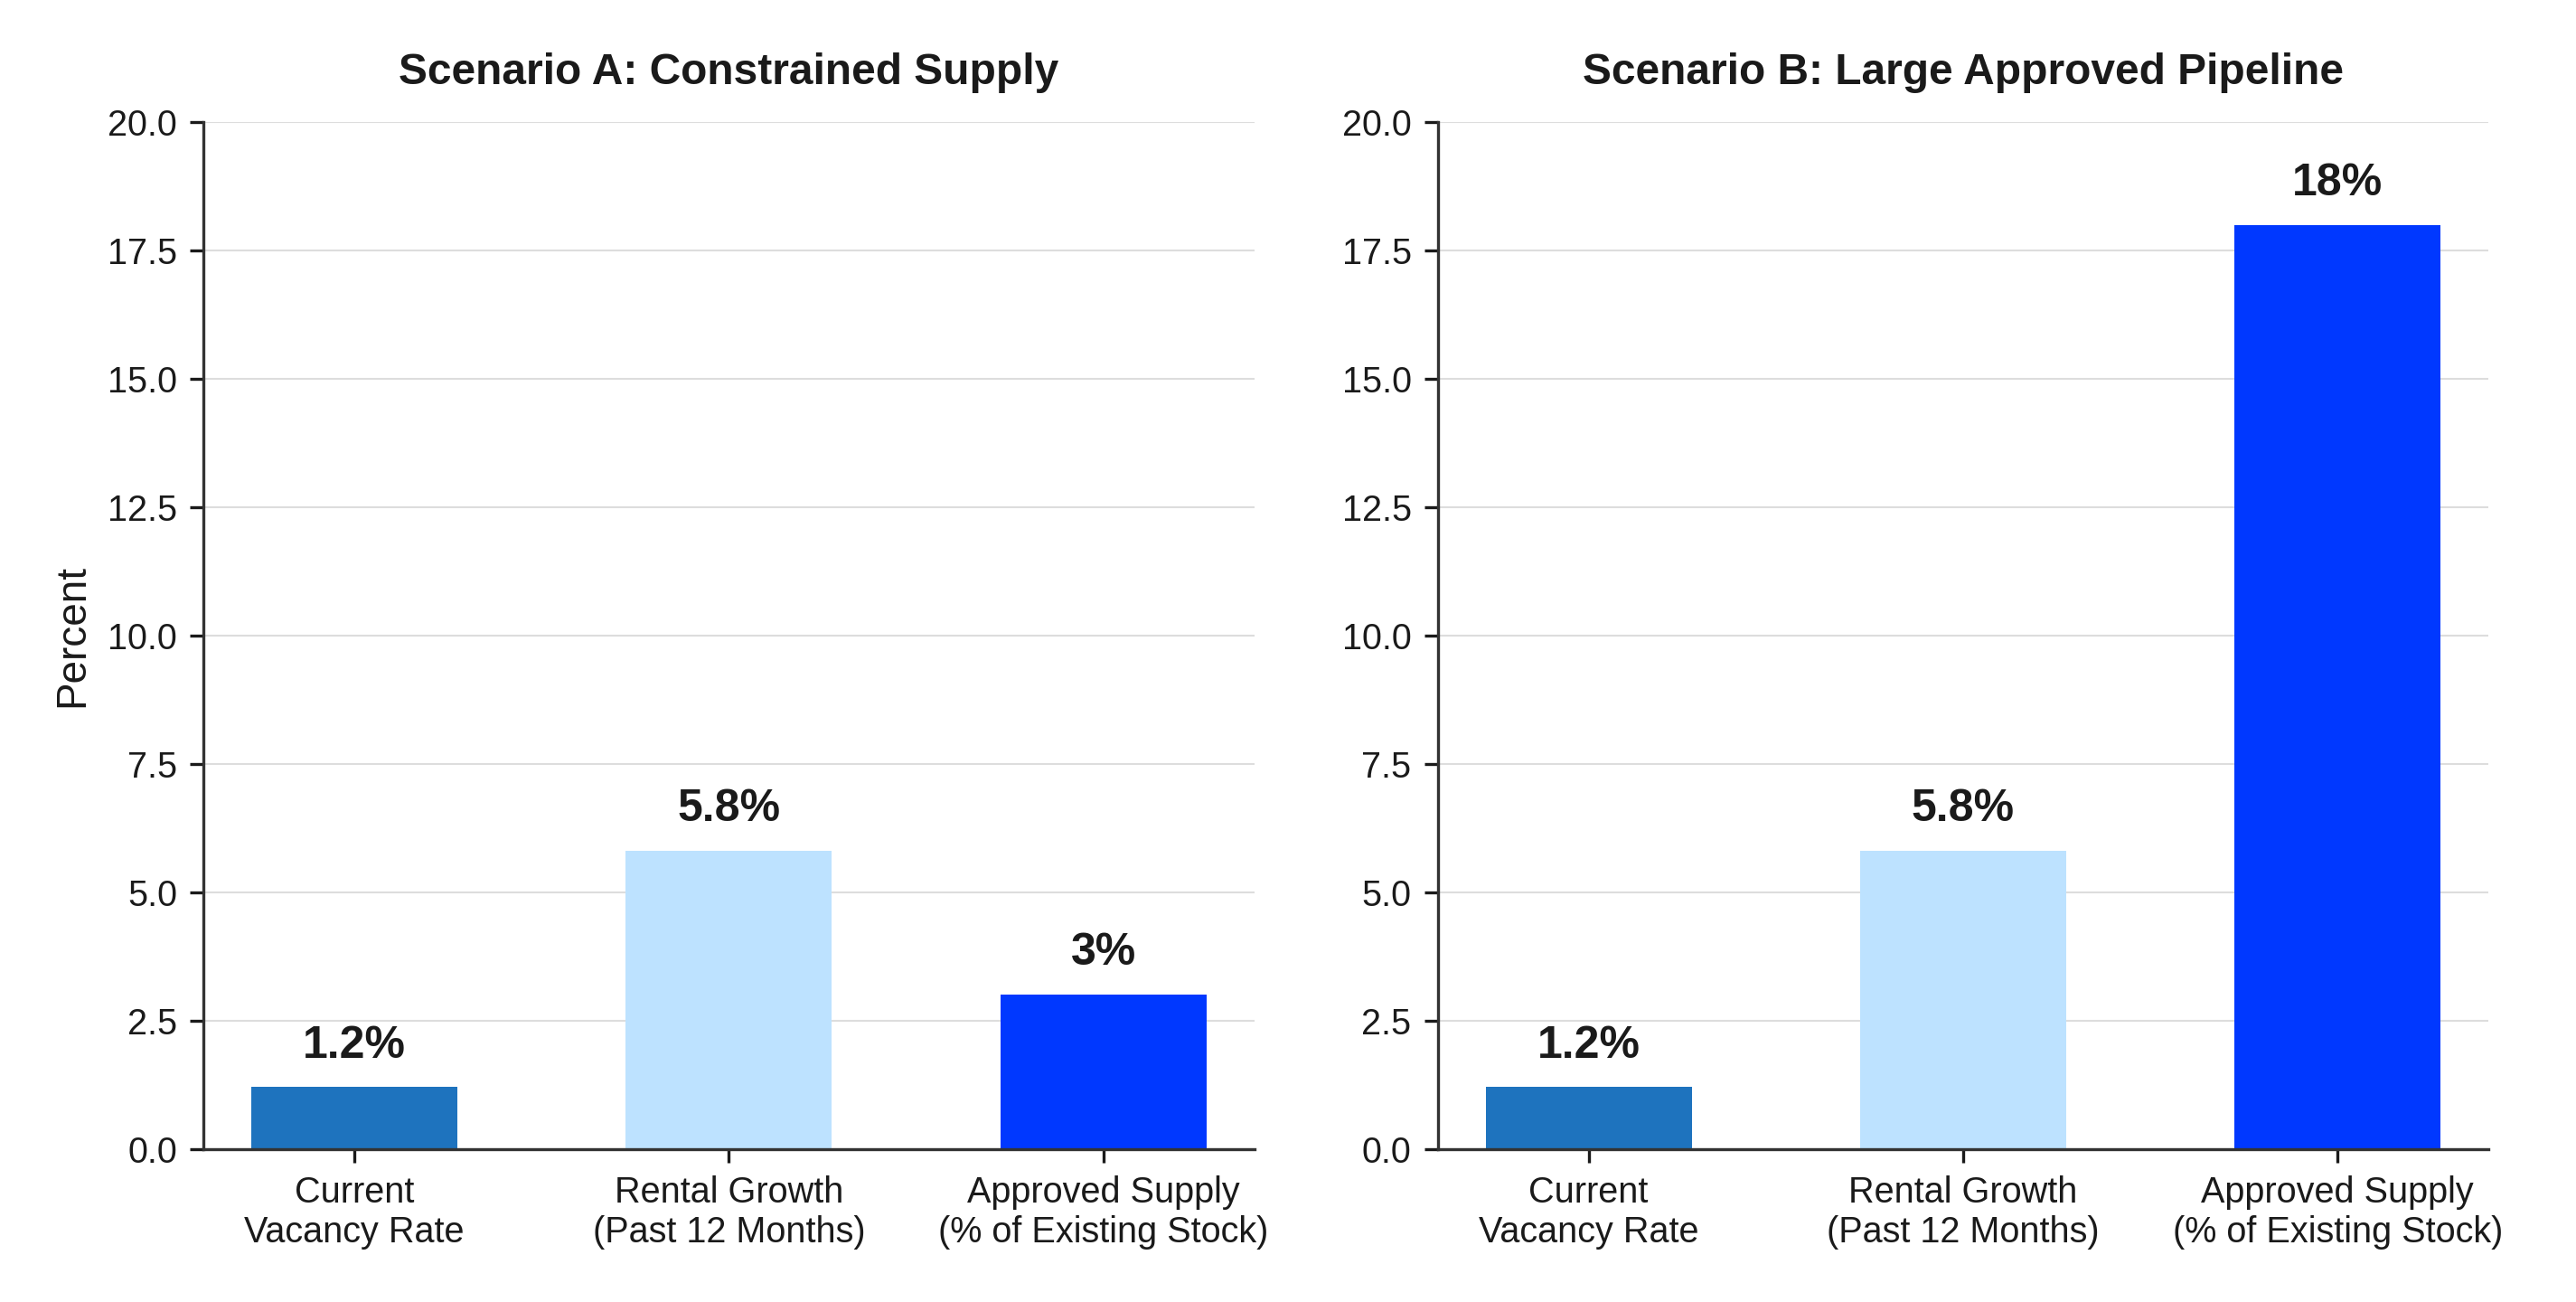
This is the conflict investors miss most often. A tight vacancy rate can sit directly alongside a large approved apartment pipeline that has not settled yet. The current number is real, and it is also temporary if the pipeline is large relative to existing stock.
Same Vacancy Rate, Two Different Supply Stories
Source: Illustrative scenario based on Cotality supply and vacancy reporting approach, 2026
Strong suburb growth, an overpriced property
A suburb can perform well while the specific property you are assessing is not good value within it. Property-level value is a comparison against genuinely similar recent sales, not against the suburb average.
Which Investment Property Metrics Deserve the Most Weight
Rather than ranking fifteen metrics, group them by the decision they answer.
First, can you afford to hold it
Borrowing capacity, debt to income ratio, serviceability and net cash flow. If this group fails, nothing else in this list matters yet.
Second, is there genuine rental demand
Vacancy rate checked against the supply pipeline, rental growth trend, and days on market or leasing speed.
Third, is there a credible growth story
Historical growth as context, population and employment trends, and confirmed infrastructure investment rather than announcements alone.
Fourth, what could go wrong
Interest rate sensitivity, oversupply risk, vacancy risk, and how quickly you could exit if your assumptions turned out to be wrong.
A Simple Hierarchy for Weighing the Metrics
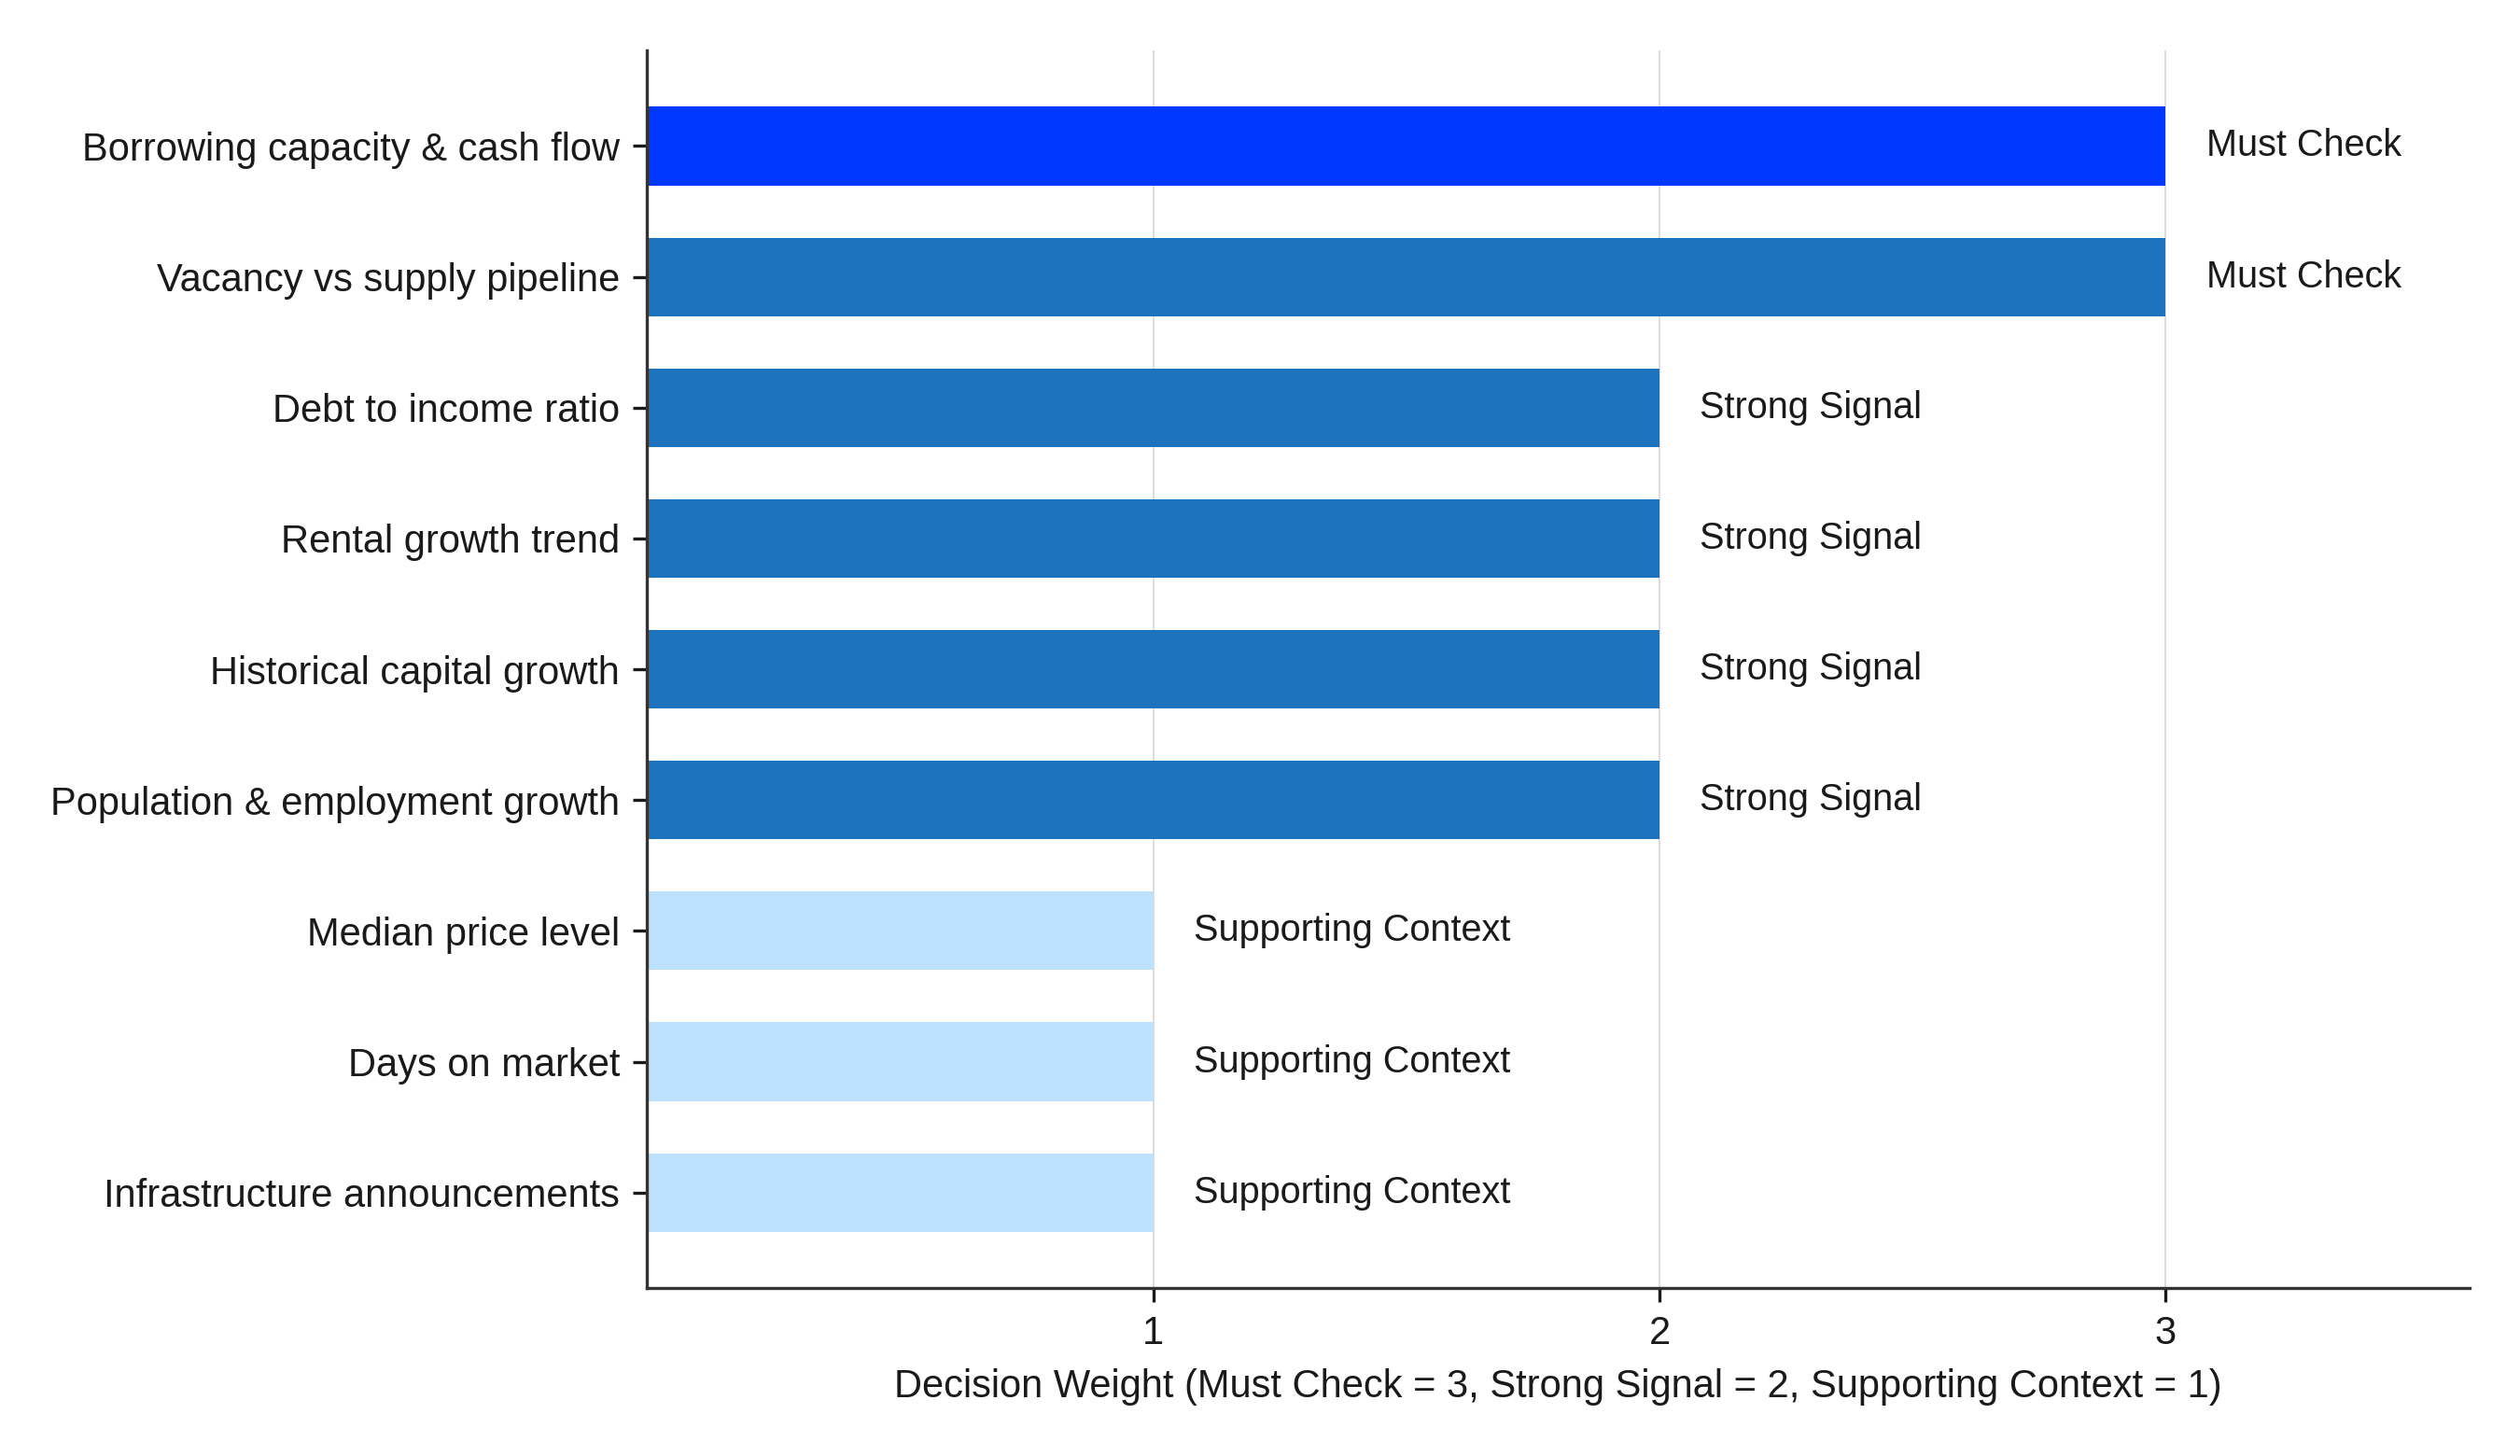
Source: FPW Group analysis, 2026
How to Analyse an Investment Property Without Relying on One Number
Start with your objective, then build the financial picture
Income, growth, portfolio expansion and wealth creation call for different weightings across the same metrics. Work through purchase price, borrowing capacity, rent, holding costs and cash flow in that order, since affordability can override every other conclusion here.
Then build the market picture and stress test it
Layer price, historical growth, vacancy, rental growth and supply pipeline over the financial picture. Then stress test it: what happens to cash flow at a higher rate, a longer vacancy or higher maintenance costs. A property that only works under today's exact conditions is fragile, not resilient.
Look for two or three metrics confirming the same direction
One strong metric is a lead. Two or three independent metrics pointing the same way, affordability, demand and growth, is closer to evidence. This is the core discipline behind every decision in this article.
Final Thoughts: Good Investment Decisions Need More Than Good Numbers
The strongest property decisions rarely come from one standout metric. They come from several independent signals, affordability, demand and growth, pointing the same direction, while staying honest about what could prove the thesis wrong.
Investment property data has never been more available. What separates a well-analysed purchase from a lucky one is whether the numbers were read together, not one at a time. Borrowing capacity sets what you can hold, rental and vacancy metrics test demand, and growth and supply metrics test the story behind the price.
That is where a second set of eyes across finance, property and strategy tends to change outcomes, not by finding a better number, but by checking whether the numbers you already have agree with each other.
Frequently Asked Questions

Recommended Reading
Two pages selected based on what readers of this article are most likely to need next.
Recommended Video
Most buyers think success comes from timing the market, but the real difference between people who build wealth and people who get stuck comes from buying the right asset with the right strategy, structure and support.