

Regional Property Market Trends: Don't Invest by the Headlines

Australia has one property market on paper, but not in practice. Australian regional property market trends, capital city results and state data are all moving in different directions, and the national headline blends them into one number that fits almost nowhere.
That matters because investors never buy the Australian market. They buy one property, in one suburb, inside a regional or capital city market with its own buyers, jobs and supply.
The gap between the regions and the capitals is wider than most headlines suggest, and the split inside regional Australia is wider still. Knowing which layer of data to trust is the first step in any property investment in Australia decision.
Australia Does Not Have One Property Market
What the National Property Market Figure Measures
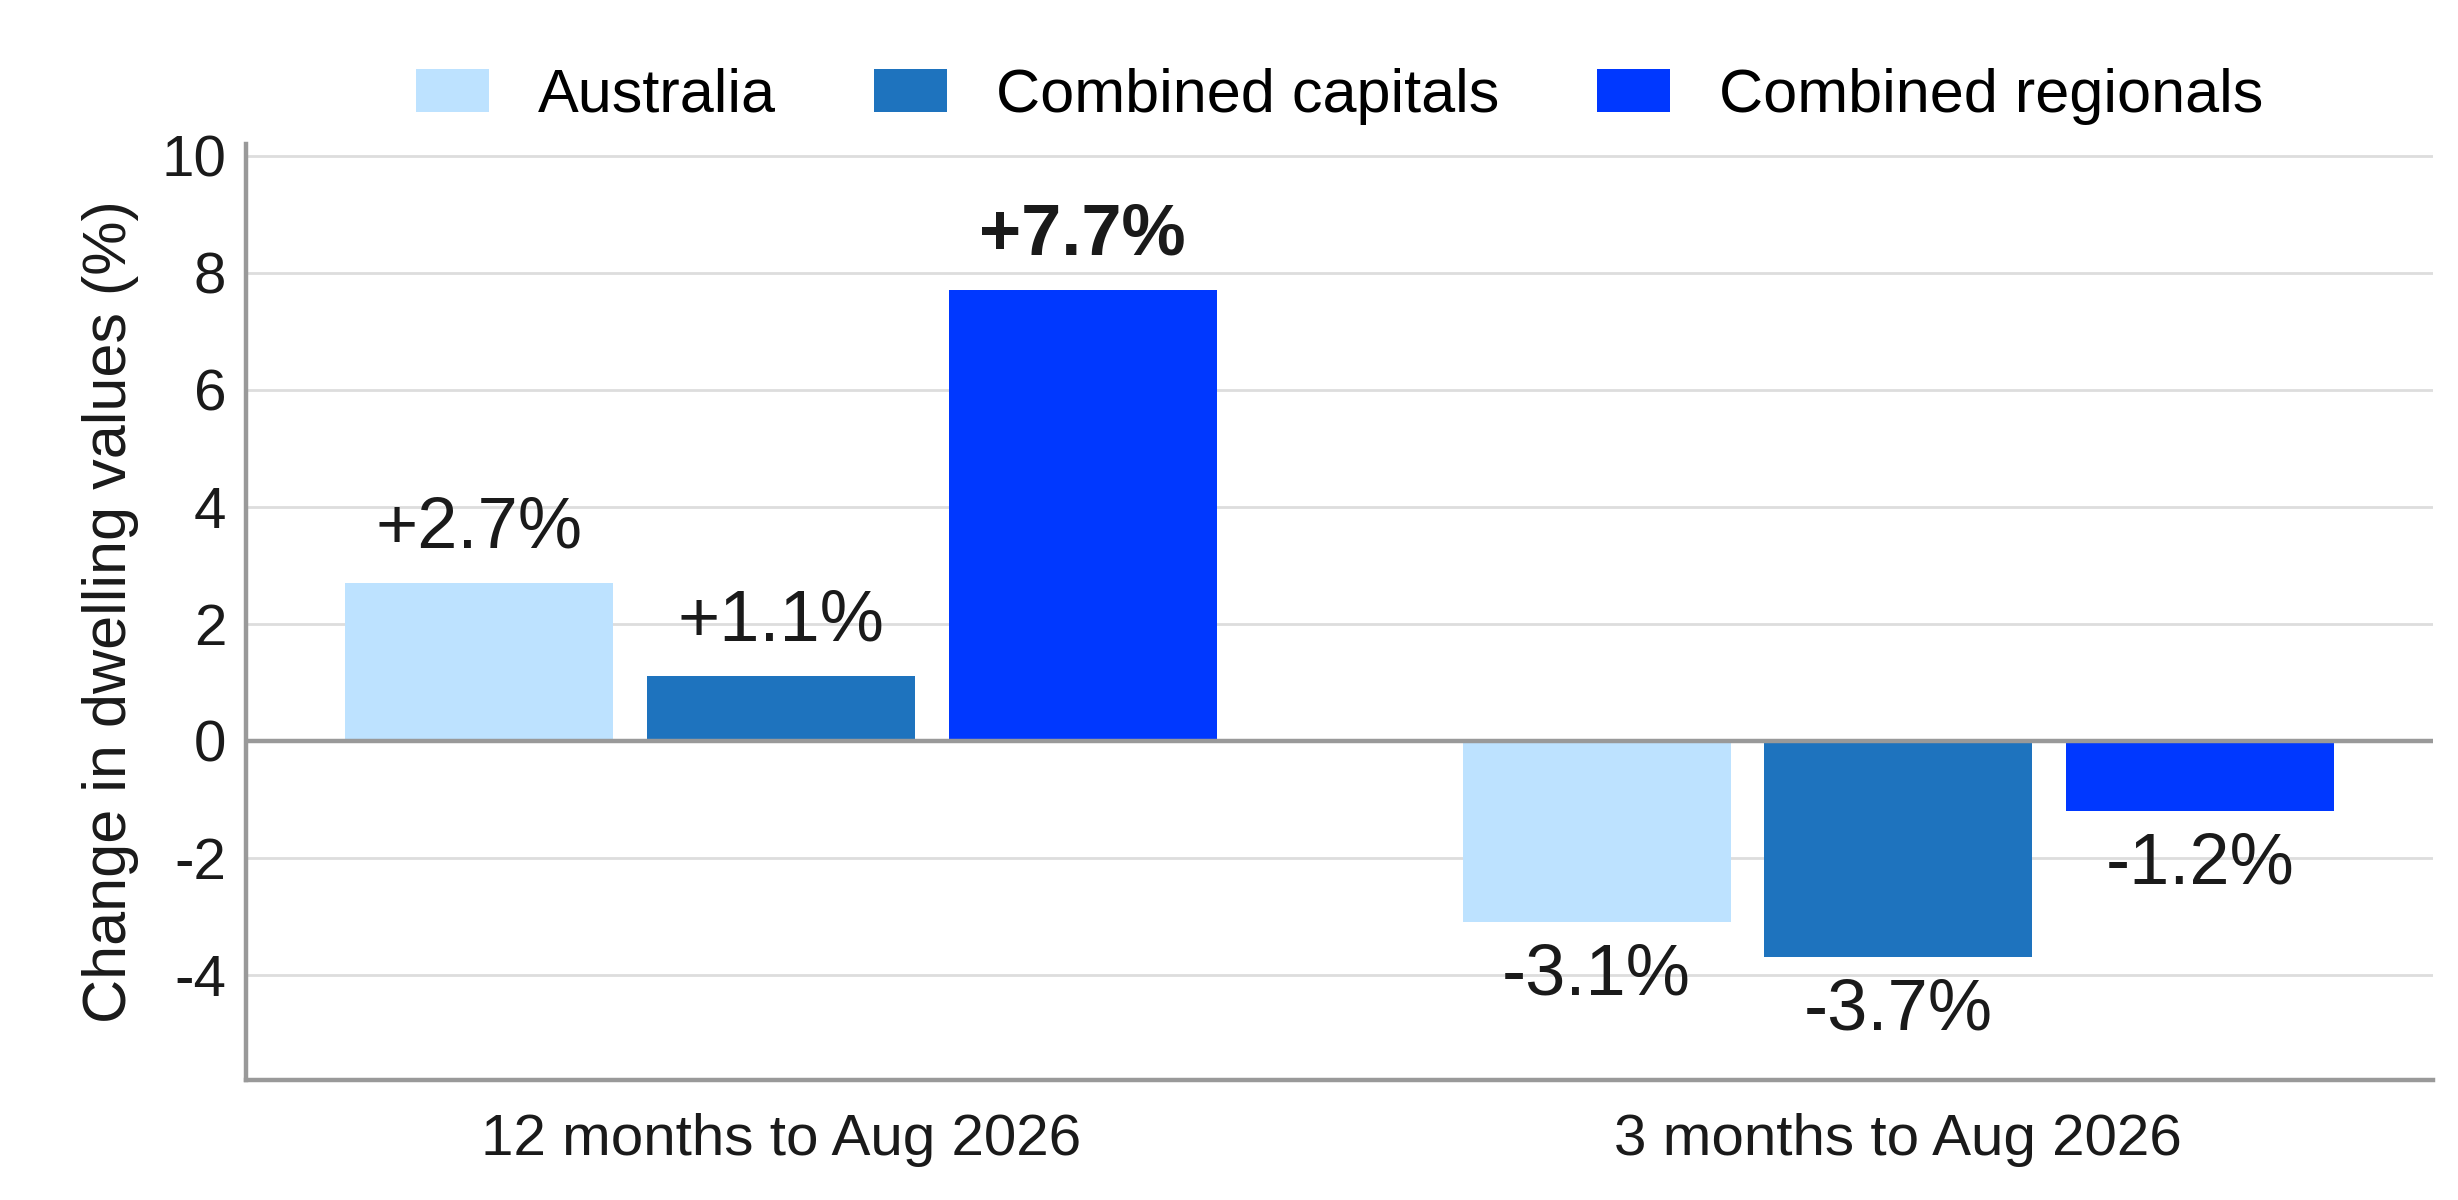
Cotality's national index rose 2.7% over the year to August 2026, according to its Monthly Housing Chart Pack. That number is a weighted blend of eight capitals and seven rest-of-state regions, and none of them recorded 2.7%.
Because the capitals hold most of the country's housing value, they dominate the result. Falls in Sydney and Melbourne pull the headline down even when most other markets are rising.
The Gap Between Capital Cities and Regional Markets
Over the same year, combined regional values rose 7.7% while the combined capitals rose just 1.1%. Both have fallen over the latest three months, but the regions by far less.
National vs Capital City vs Regional Dwelling Values, to August 2026
Source: Cotality, Monthly Housing Chart Pack, September 2026
Why "Regional Australia" Is Not One Market Either
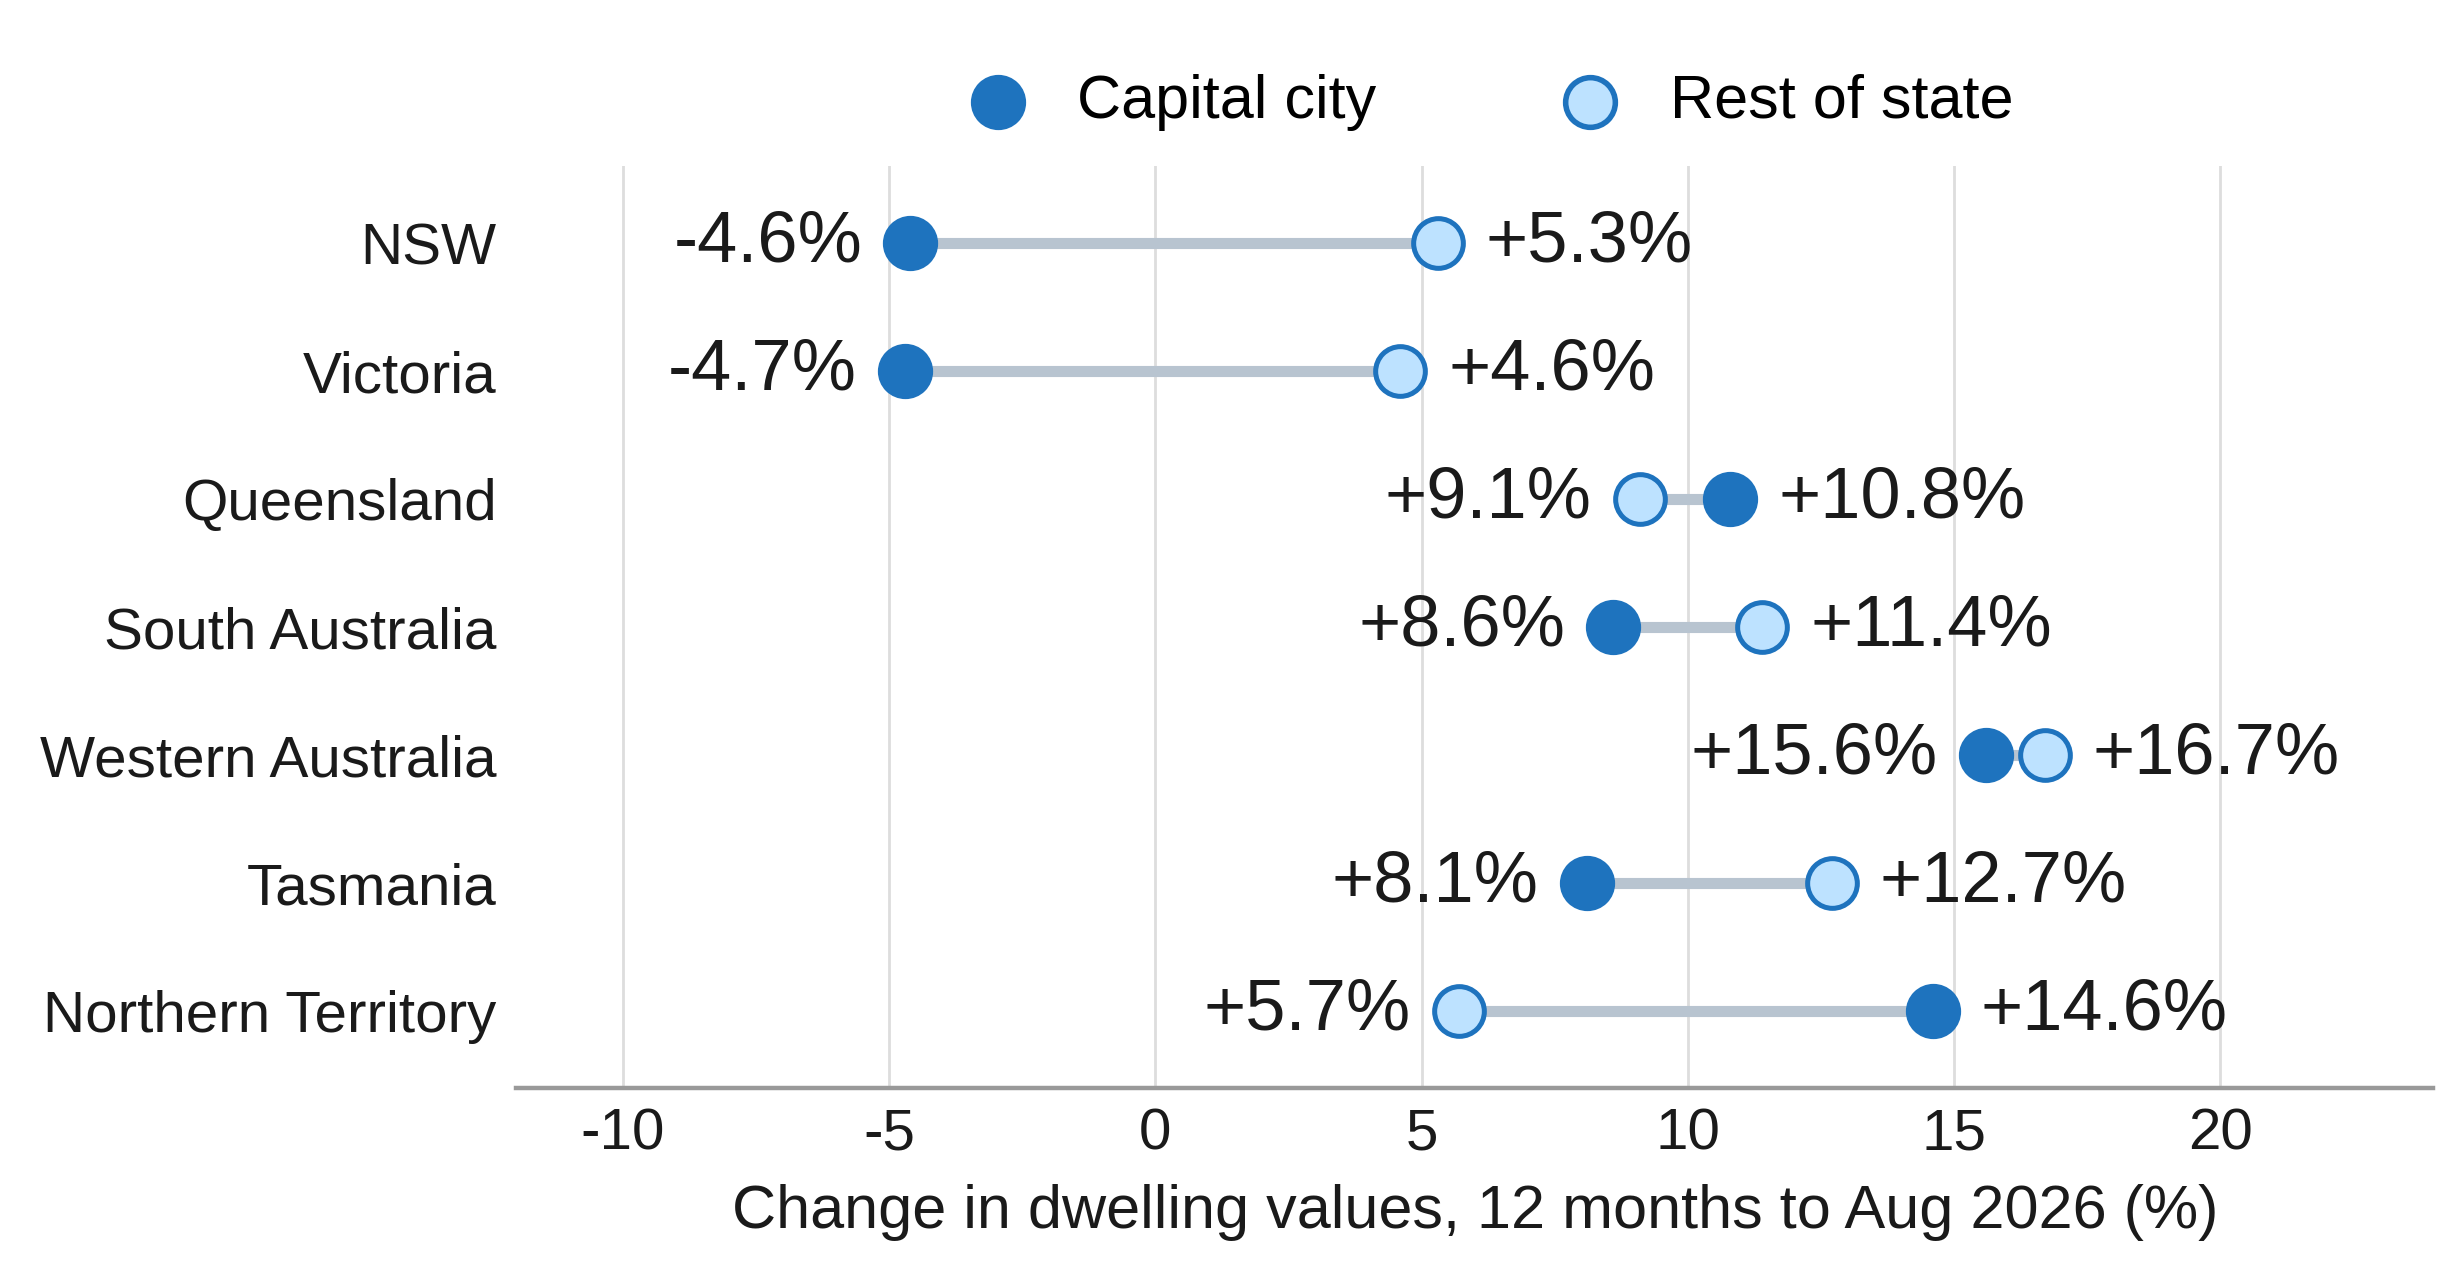
Regional Australia is itself a blend of very different economies. The chart below compares each state's capital with the rest of that state, and the gaps run in both directions.
Capital City vs Rest of State Dwelling Values by State, 12 Months to August 2026
Source: Cotality, Monthly Housing Chart Pack, September 2026
Australian Regional Property Market Trends Are Moving Differently
What Australian Regional Property Market Trends Show by State
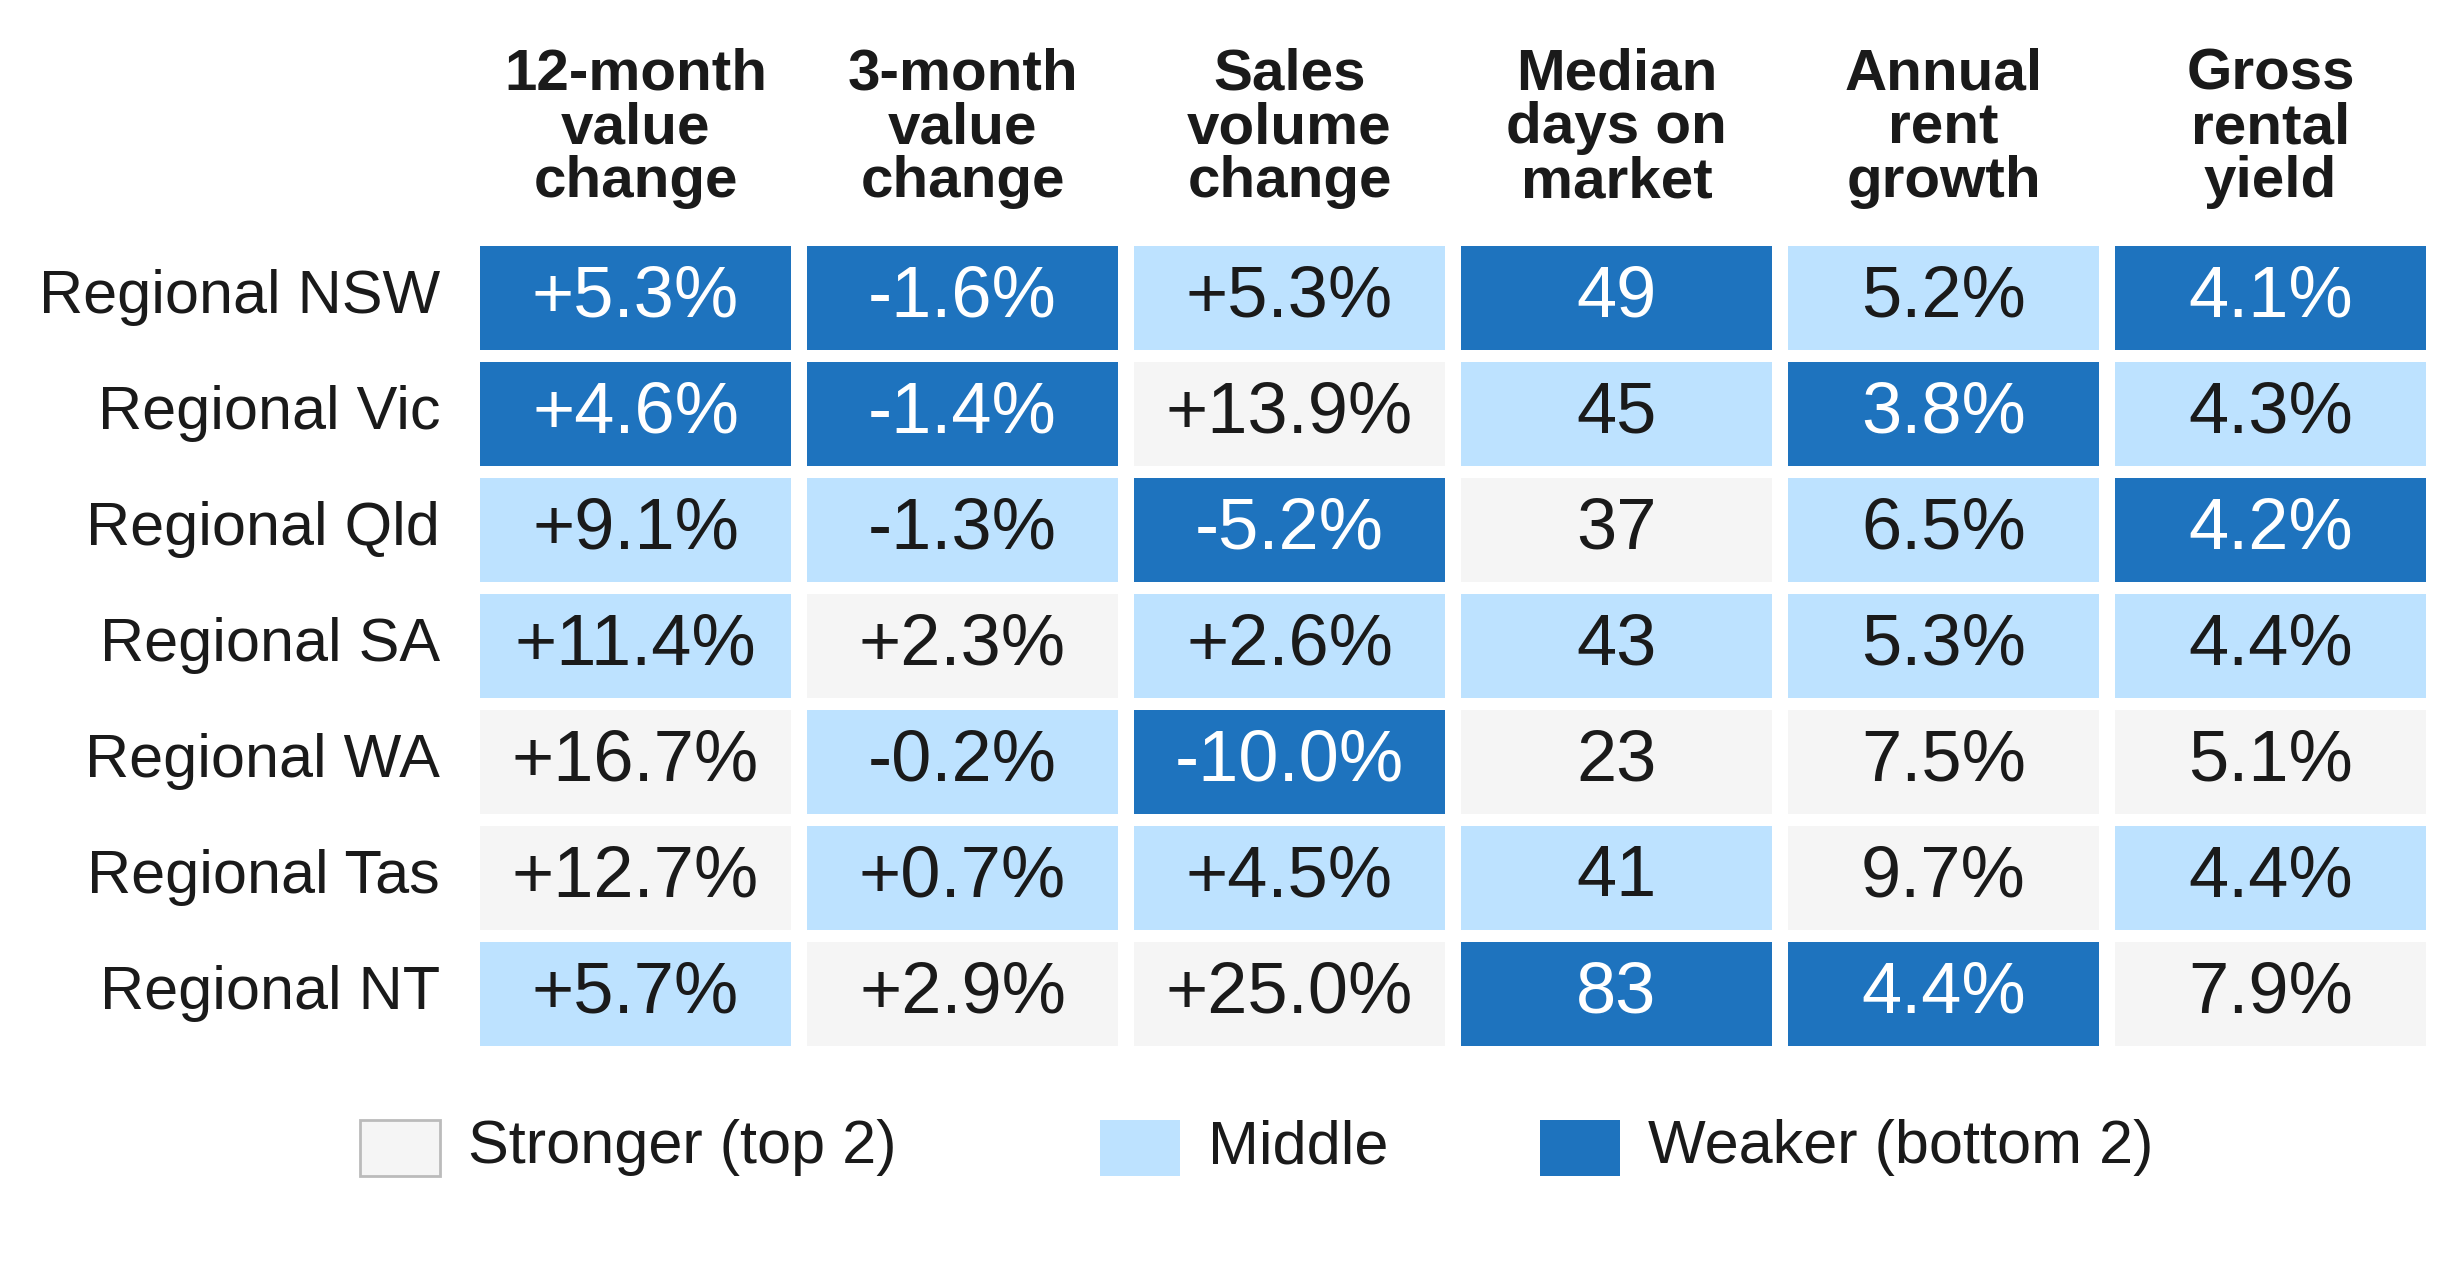
Growth is only one measure. Across the seven regional markets, sales activity, selling times, rent growth and yields rank in almost completely different orders.
Regional Market Scorecard by State, August 2026
Source: Cotality, Monthly Housing Chart Pack, September 2026
Where Regional Markets Are Diverging
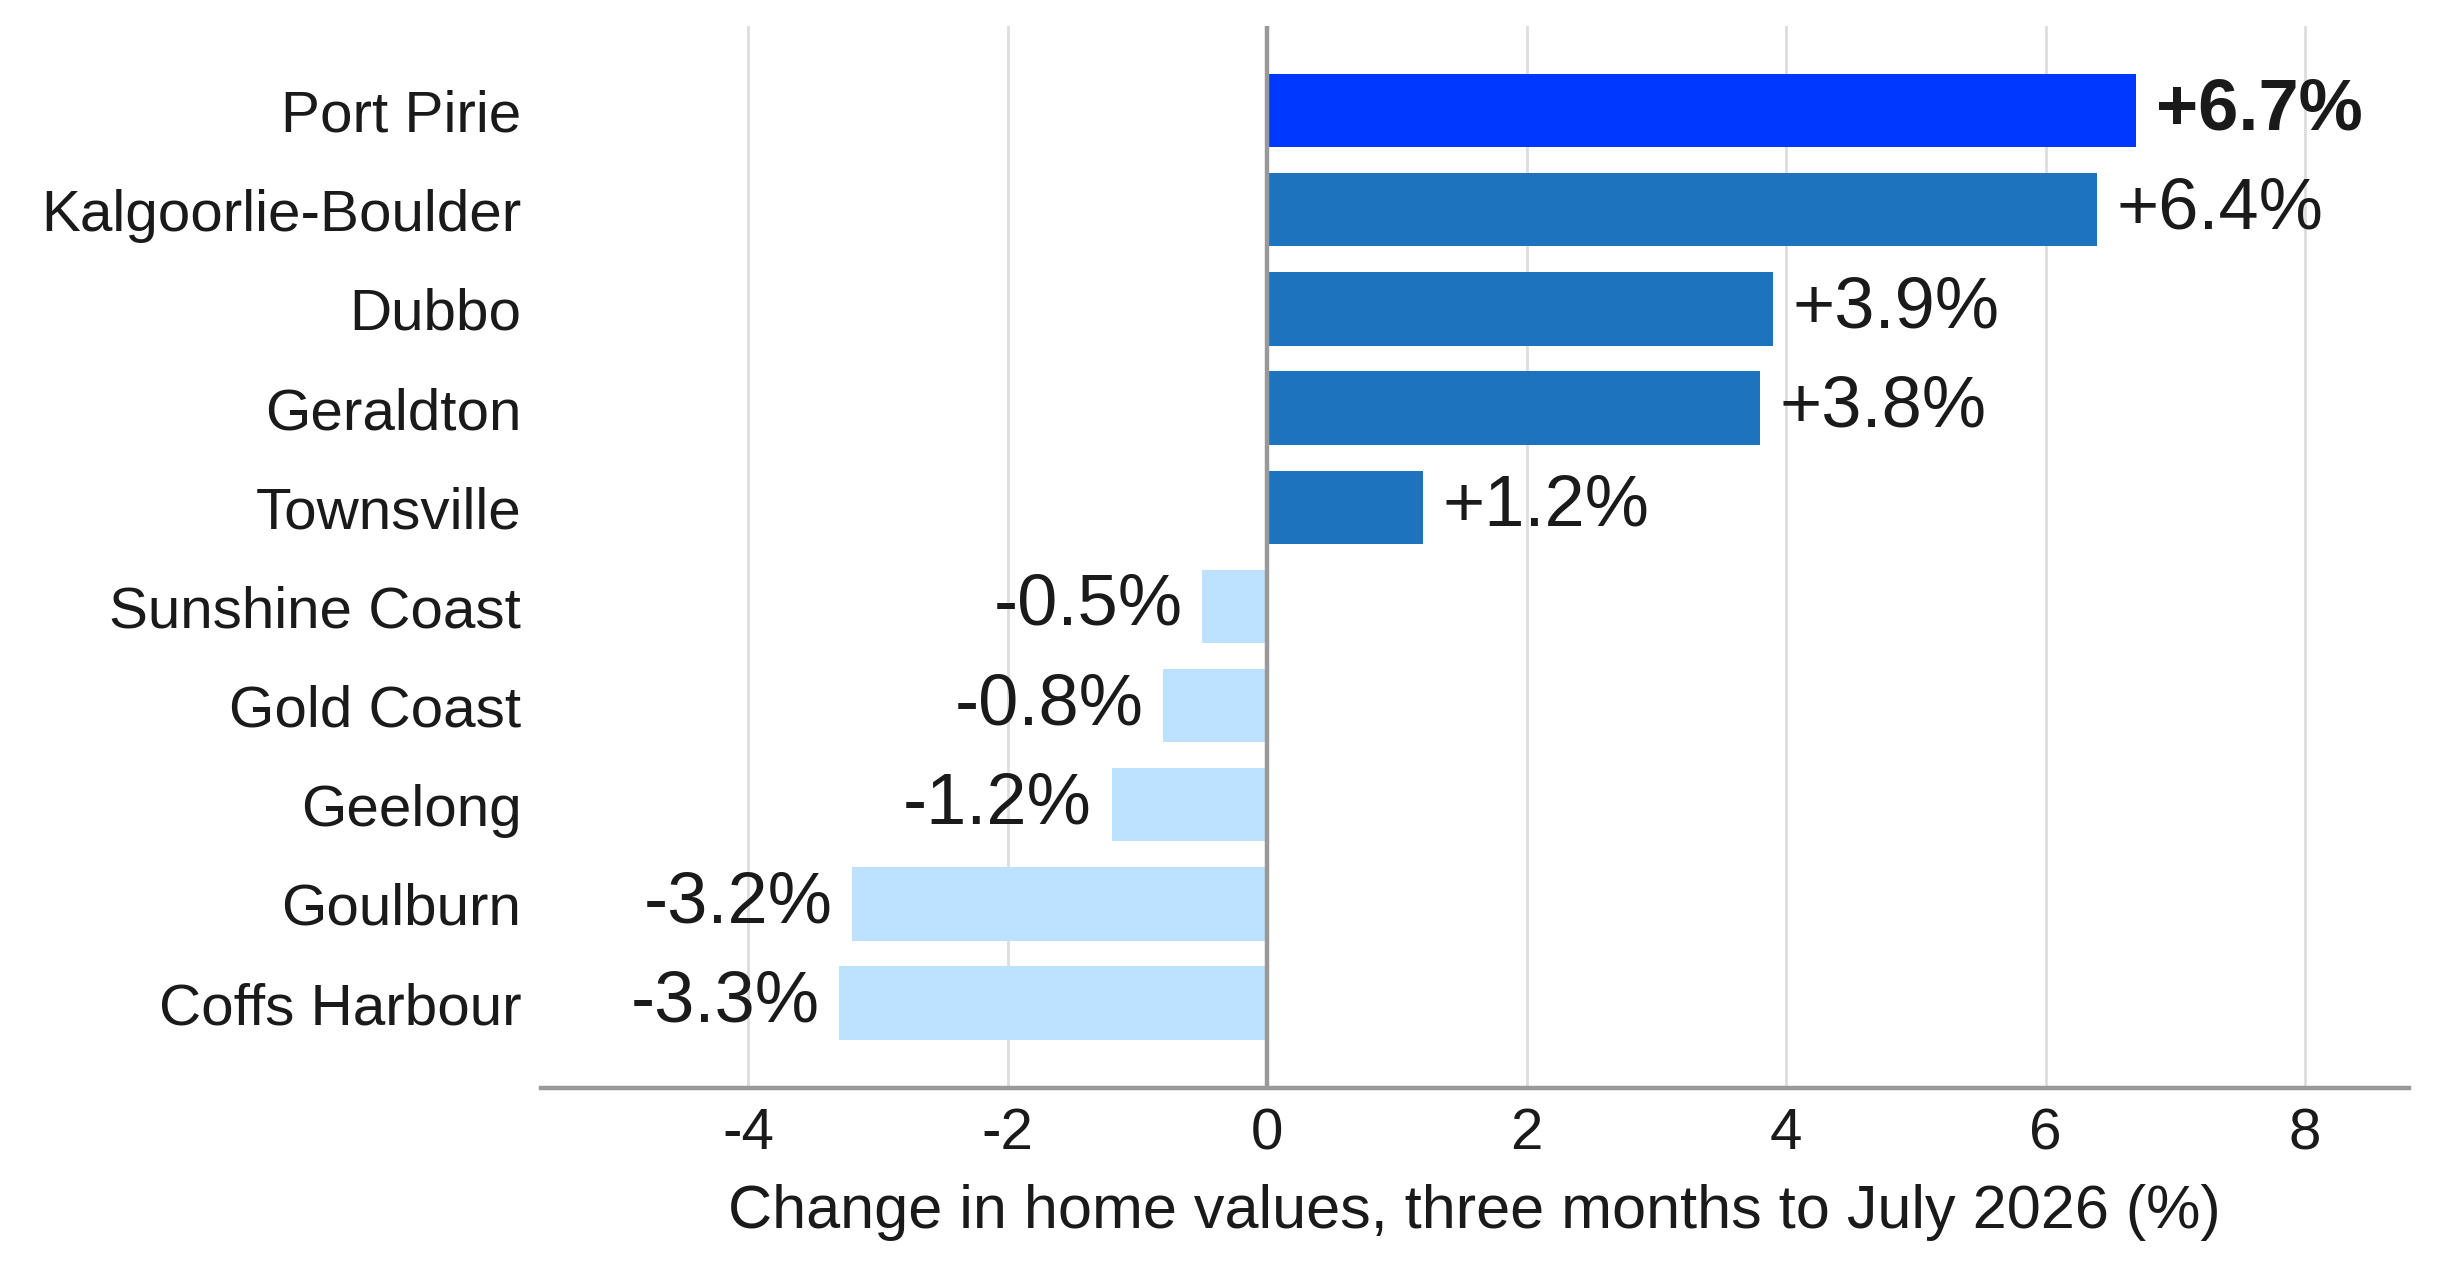
The split runs right down to individual towns. In the three months to July 2026, Port Pirie rose 6.7% and Kalgoorlie-Boulder 6.4%, while Coffs Harbour fell 3.3% and Goulburn 3.2%.
Change in Home Values, Selected Regional Centres, Three Months to July 2026
Source: Cotality Regional Market Update, reported by The Urban Developer, August 2026
Why Regional Performance Varies So Widely
Cotality found buyers are moving away from lifestyle towns toward cheaper centres with strong local demand. Selling conditions show the same split, with a median of 11 days on market in Kalgoorlie-Boulder against 86 days in Bowral-Mittagong.
That is why some of the underrated property markets in Australia look nothing like the regional towns that led the last upswing.
The Capital Cities Are Not Moving as One Market Either
Different States, Different Property Cycles
Over the year to August 2026, Perth values rose 15.6%, Darwin 14.6% and Brisbane 10.8%, while Sydney and Melbourne fell and Canberra was flat. Sydney is now 7.1% below its February 2026 peak, and Melbourne remains 6.8% below a record set in March 2022.
Why Affordability Changes the Picture
The ABS puts the mean dwelling price at $1,304,900 in NSW and $614,400 in the Northern Territory as of the June quarter 2026. Lenders cap loans relative to income through measures such as the debt to income ratio, so the same buyer can reach very different homes in different states.
That is a big part of why capital city growth has shifted away from Sydney and Melbourne. Our comparison of property investors in Brisbane, Adelaide and Perth covers how that shift has played out.
How Population and Migration Shift Local Demand
People follow jobs and affordability, and housing demand follows people. The ABS figures below show how uneven that movement was in the year to March 2026.
Source: ABS, National, state and territory population, March 2026
Queensland and WA gained over 25,000 interstate residents between them, while NSW lost almost 21,000. Lifestyle migration feeds some of those flows, but job-led moves shape others.
What Creates Differences Between Property Markets?
Five drivers explain most of the gaps between markets. Each one can push two locations in opposite directions at the same time.
Supply needs a close look. It moves slowly and differs a lot by state, as our look at housing supply in Australia shows.
Why National Property Market Headlines Can Be Misleading
A Rising National Median Does Not Mean Every Market Is Rising
National values rose 2.7% over the year to August, yet Sydney and Melbourne both fell more than 4%. An investor in either city lived through a very different year from the headline.
A Slowing National Market Does Not Mean Every Market Is Slowing
The reverse is also true. National values fell 3.1% over the three months to August, while Darwin, regional SA, regional Tasmania and regional NT still rose.
What Investors Can Miss by Relying on Averages
Averages hide timing, turning points and thin markets. They also create the kind of hype that explains why property hotspots never boom for the buyers who arrive late.
How to Compare Australian Property Markets
A simple way to cut through the noise is to move down five levels, from the broadest data to the most specific. Each level narrows the question and changes what you look for.
At the local level, five checks do most of the work: price and price growth, supply and demand, population and job drivers, rental conditions, and transaction activity. Our guide to reading the property market and spotting growth walks through each one.
If you are choosing between local or interstate investment locations, this stops a strong state headline from hiding weak local numbers.
This is where an investment property strategy built on local evidence earns its keep.
Final Thoughts: Look Past the Headlines
The headline gives you one number. Investors buy into very different markets. Australian regional property market trends show the regions beating the capitals, states splitting on migration and cost, and towns in the same region moving in opposite ways.
The national figure is still useful for context. It tells you about the cycle, interest rates and lending conditions that affect every buyer. It just cannot tell you what will happen in the town or suburb you buy in.
The decision always happens locally. Check the state, the capital or regional split, the local market and the property type before you trust any headline number. That order stops a strong national story from hiding a weak local one.
Frequently Asked Questions

Recommended Reading
Two pages selected based on what readers of this article are most likely to need next.
Recommended Video
Most investors are still positioned in capital cities — but in 2026, that allocation gap is creating real opportunity cost. In a market where timing, positioning, and yield profiles compound into long-term outcomes, that disconnect matters more than most people realize.