

Property Sales Data: Where Can You Actually Sell Right Now?

Whether you can sell an investment property when you need to depends less on what it is worth and more on how actively its market trades. Property sales data, meaning how many homes transact, how long they take to sell and how much stock competes for the same buyers, gives you the clearest early read on that exit risk.
Most investors check the median price and the growth chart, then stop. That tells you value. It does not tell you liquidity, and over the past year the gap between the two has widened in ways a price chart will never show.
Perth still sells fastest, yet its sales have fallen further than any other capital and its listings have jumped 53.3%. Brisbane's selling time has nearly doubled, while Hobart and Darwin look steadier than either.
Before comparing Australian investment locations on growth alone, check which markets are still absorbing listings.
Why Property Sales Matter More Than the Sale Price
A property's price tells you what the last buyer paid. Property sales activity tells you how many buyers turned up to pay it, and how quickly.
That matters most at the exit. You may need to sell to release equity, cover a drop in income or fund retirement, and none of those moments wait for the market.
What Property Sales Data Can Reveal
Cotality estimates that 527,173 homes sold across Australia in the 12 months to August 2026, from a stock of roughly 11.5 million dwellings, according to its Monthly Housing Chart Pack. That works out to about 4.6% of all homes changing hands in a year, or roughly one in every 22.
Turnover varies widely between suburbs. A pocket where 7% of homes trade each year is a very different place to sell than one where 2% do, even at the same median price.
Raw records are easy to find. The NSW Government's property sales search tool filters sales by suburb, street, date, price and property type. Reading what they imply is the hard part.
What Does Property Market Liquidity Mean for Investors?
Liquidity is how easily an asset sells close to fair value within a reasonable time. Shares sell in seconds, but property needs a buyer to find it, secure finance, negotiate and settle, which can take months.
So, property is never truly liquid. What changes is how illiquid a market is, and which way it is heading.
The Property Sales Numbers That Reveal Market Depth
Four measures do most of the work: days on market, sales volume, listings and buyer demand. Together, they show whether a market is absorbing stock or backing up.
Days on Market: How Long Homes Are Taking to Sell
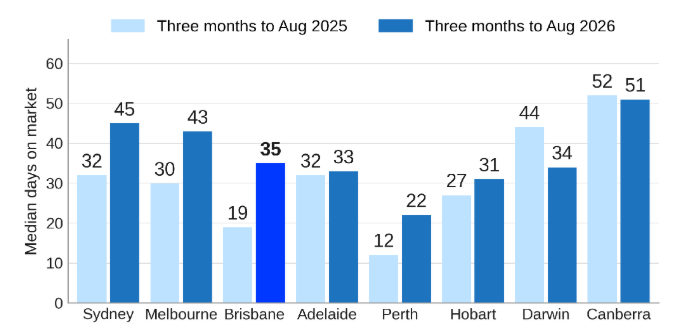
Median days on market is the time from listing to sale. Nationally, it rose to 39 days in the three months to August 2026, up from 28 days a year earlier.
The spread between capitals is wider than most buyers realise. Canberra sits at 51 days and Sydney at 45, while Perth remains the fastest at 22 days despite nearly doubling from 12.
Median Days on Market by Capital City, 2025 vs 2026
Source: Cotality, Monthly Housing Chart Pack, September 2026
Property Sales Volume: How Many Transactions Are Happening
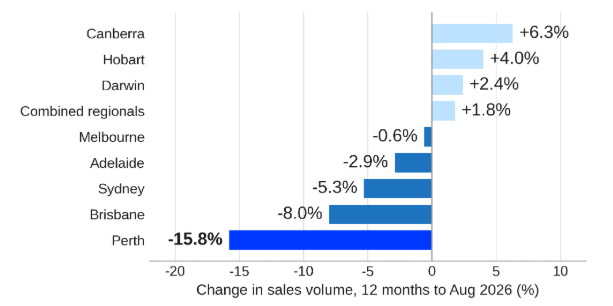
Volume shows whether buyers are still turning up in numbers. National sales fell 2.7% over the year to August 2026, but the split underneath was sharp: capital city volumes fell 5.2% while regional sales rose 1.8%.
Change in Property Sales Volume by Capital City, 12 Months to August 2026
Source: Cotality, Monthly Housing Chart Pack, September 2026
Property Listings: How Much Stock Is Competing for Buyers
Total listings count every home for sale over a set period. Nationally, just over 139,100 homes were listed in the four weeks to 6 September 2026, up 18.1% on a year earlier and now above the five-year average.
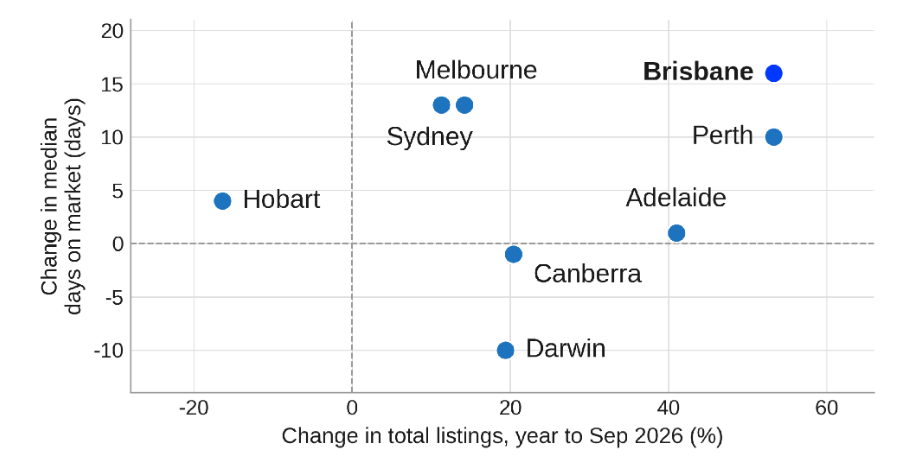
That build-up is concentrated. Total listings in Brisbane and Perth were both up 53.3% year on year, while Hobart's fell 16.4%, a shift that reshapes any Perth versus Brisbane market comparison built on growth alone.
Listings Growth vs Selling Time by Capital City
Source: Cotality, Monthly Housing Chart Pack, September 2026
Buyer Demand: Are Enough Buyers Still Bidding?
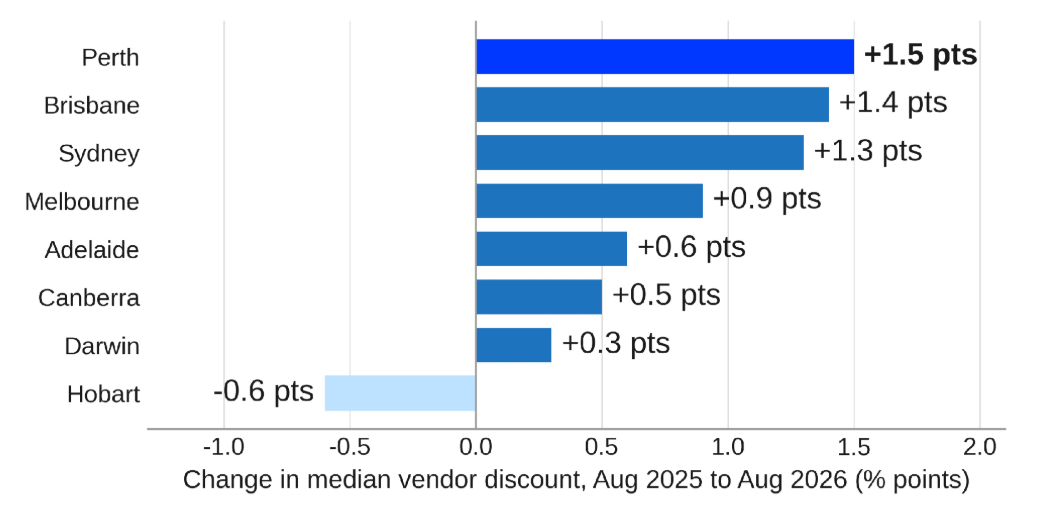
Demand is read through proxies. The median vendor discount across the capitals widened to 4.2% in the three months to August 2026, the largest in at least two years. Capital city clearance rates have held below 50% since early June.
Brisbane's four-week average clearance rate was the lowest at 32.8%, a sign vendors and buyers still disagree on price. Auction clearance rates and enquiry levels both tend to move before prices do.
REA Group's FY26 results also flagged slower buyer enquiry growth after three rate rises.
Change in Median Vendor Discount by Capital City, August 2025 to August 2026
Source: Cotality, Monthly Housing Chart Pack, September 2026
Selling vs Selling at Your Target Price
This is the distinction many investors miss. Longer selling times add holding costs, but a wider discount usually costs far more.

Why Some Locations Are Easier to Sell Than Others
Liquidity comes from the size of the likely buyer pool, which is shaped by price point, property type and the local economy.
Price Points and the Size of the Buyer Pool
The more buyers who can afford a property, the more chances it has to sell. That pool moves with how lenders calculate borrowing power.
With the cash rate at 4.35% after three hikes earlier this year, Cotality estimates a median-income household's borrowing capacity fell by 7.0%, or more than $53,000. That quietly removes buyers from the top of each price bracket.
That is why the top end fell first, with upper-quartile house values in Sydney and Melbourne down more than 10% from their peaks.
Houses, Units and Property Type
Property type changes who your buyers are. A standard three-bedroom house in a family suburb suits owner-occupiers and investors alike, while a studio, dual-key unit or unusual build draws from a much smaller pool.
Units also carry a supply risk, because one new tower can add dozens of competing listings at once. Our guide on house vs apartment as a first purchase covers this.
Local Jobs and Population Growth
Suburbs with diverse jobs, transport and services attract a steady flow of buyers. Single-industry towns can lose buyer depth fast when that anchor weakens.
Population growth helps but guarantees nothing, which is why choosing investment-grade suburbs means looking past headline figures.
Can High Property Sales Volume Make a Market More Liquid?
More transactions usually mean more price evidence and more active buyers, which makes selling smoother.
Volume alone can mislead, though. Regional Northern Territory recorded a 25.0% jump in sales over the year to August 2026, yet its median selling time sat at 83 days, more than double the national figure.
The combined regional markets show the same tension. Sales rose 1.8%, while median time on market climbed to 42 days, close to the 43-day peak recorded in February 2025.
Combine Property Sales Volume With Days on Market
Read together, the two tell you far more than either alone.
Perth sits in the fast but thinning box. Sydney, with falling volume and 13 more days on market, sits closer to thin and slow.
How to Assess Property Liquidity Before You Buy
Checking the exit is quicker than most buyers expect. This test uses free or low-cost data and works at city, suburb or street level.
The Five-Part Liquidity Test
Compare like with like. Read the suburb profile by property type, and use a 12-month trend rather than one monthly figure.
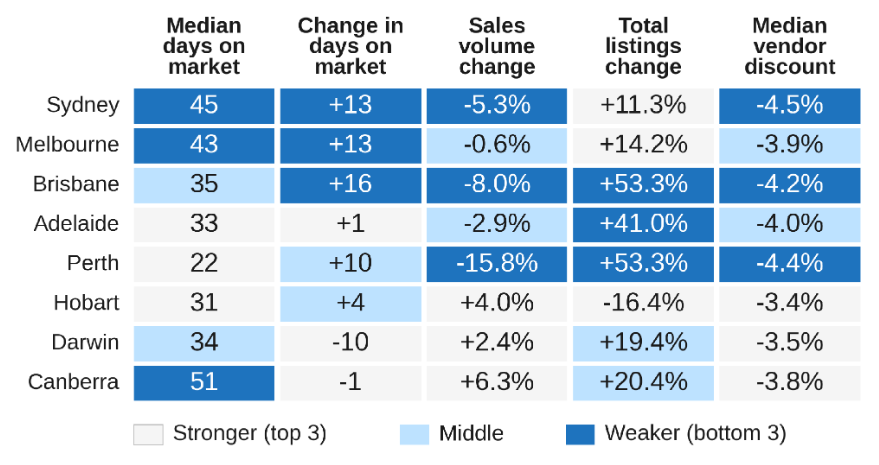
The scorecard applies the first three tests, plus vendor discounting, to all eight capitals. Shading shows each city's rank against the others, not a pass or fail.
Capital City Liquidity Scorecard, August 2026
Source: Cotality, Monthly Housing Chart Pack, September 2026; rankings by FPW Group
Property fit is where data runs out and judgement takes over. It is also where an investment property strategy built around your exit, not only your purchase, earns its keep.

What Property Sales Data Cannot Tell You
Data describes the past. Liquidity can change within a single year, as Perth's move from 12 to 22 days on market shows.
One Suburb Can Hold Several Markets
Medians blend very different stock. Renovated houses on quiet streets may sell in a fortnight while units on a busy road sit for months, in the same postcode.
Liquidity Is Not the Same as Capital Growth
Perth values rose 15.6% over the year to August 2026 as its sales volume fell sharply. Sydney and Melbourne values fell 4.6% and 4.7%, yet both remain among the deepest buyer pools in the country.
A liquid market can still fall in value, and an illiquid one can still grow. Growth needs its own analysis, which our guide to reading the property market and spotting growth covers in detail.
Final Thoughts
Whether you can sell when you need to comes down to how deep and active your market is at the moment you list. Property sales data gives you an early read on that: how many homes trade, how quickly they sell, how much stock is competing, whether buyers are still bidding and how much sellers give up on price.
The past year shows how fast those conditions can shift. National selling times stretched by 11 days, capital city sales fell and listings climbed in the very markets that looked strongest a year ago.
None of this means avoiding those cities. It means checking the exit with the same care as the entry, and buying the kind of property the next buyer in that suburb will want.
Frequently Asked Questions

Recommended Reading
Two pages selected based on what readers of this article are most likely to need next.
Recommended Video
Most buyers think success comes from timing the market, but the real difference between people who build wealth and people who get stuck comes from buying the right asset with the right strategy, structure and support.