

Perth Property Market vs Brisbane: Which Offers Better Investment Potential?
The Perth property market is currently outrunning Brisbane on capital growth, but Brisbane is quietly building a case of its own that could matter more depending on what kind of investor you are. Both cities are outperforming Sydney and Melbourne through 2026, just for very different reasons.
One market is being driven by a shortage so severe it's reshaping the entire growth curve. The other is riding a multi-billion-dollar infrastructure wave most investors haven't priced in yet. Which one suits your strategy comes down to whether you're chasing speed or backing balance, and the numbers below make that a lot clearer than the headlines do.
Perth and Brisbane Property Market Snapshot
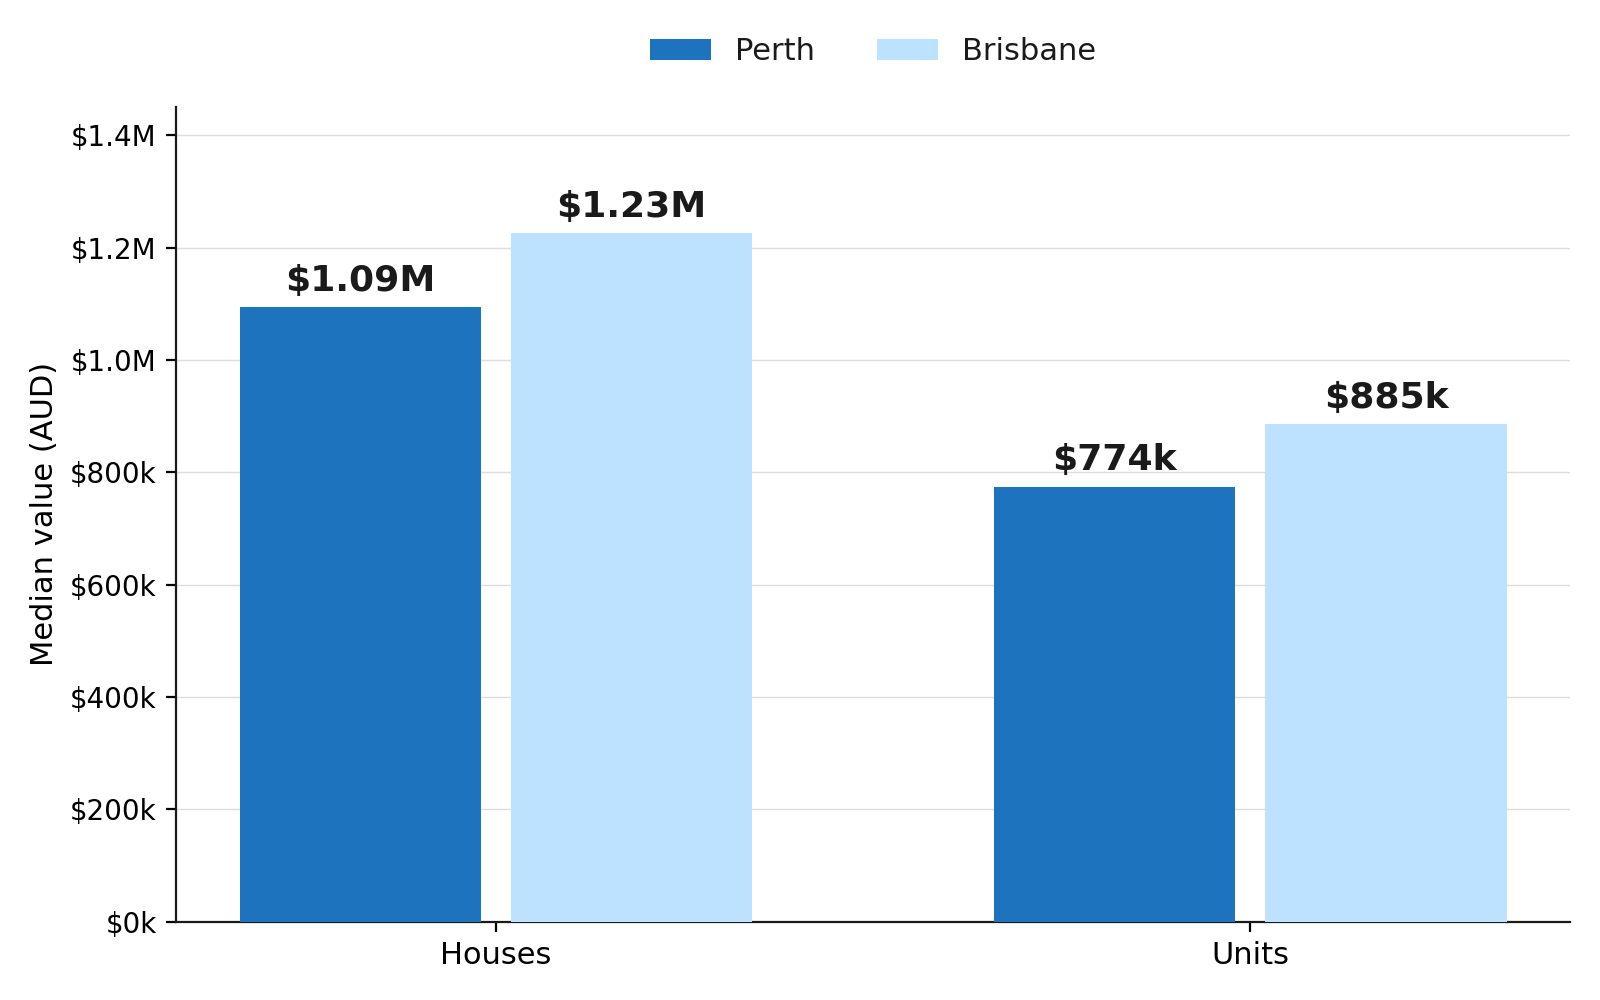
Perth's median house value reached $1,093,431 in mid-2026, up 23.6 percent over the year, while units climbed even faster to $773,605, a gain of 26.3 percent. That pace makes Perth the strongest performing capital city market in the country right now, driven by a WA economy still anchored in resources and a housing supply pipeline that has not kept up with demand.
Brisbane's median house value sits higher at $1,225,350, up 16.8 percent annually, with units at $885,132, up 20.3 percent. Growth has slowed slightly from its 2025 pace but remains well ahead of the national average, supported by interstate migration into Queensland's property investors and confirmed 2032 Olympics infrastructure spending.
Perth vs Brisbane: Key Figures at a Glance
Median Dwelling Values: Perth vs Brisbane
Source: Cotality Home Value Index, 2026
The gap between the two cities is now over $130,000 on houses alone. That difference changes the deposit an investor needs and the loan size a lender will assess, which matters as much as the growth rate itself when comparing Perth property investment against Brisbane real estate.
Perth vs Brisbane: Capital Growth and Rental Yields
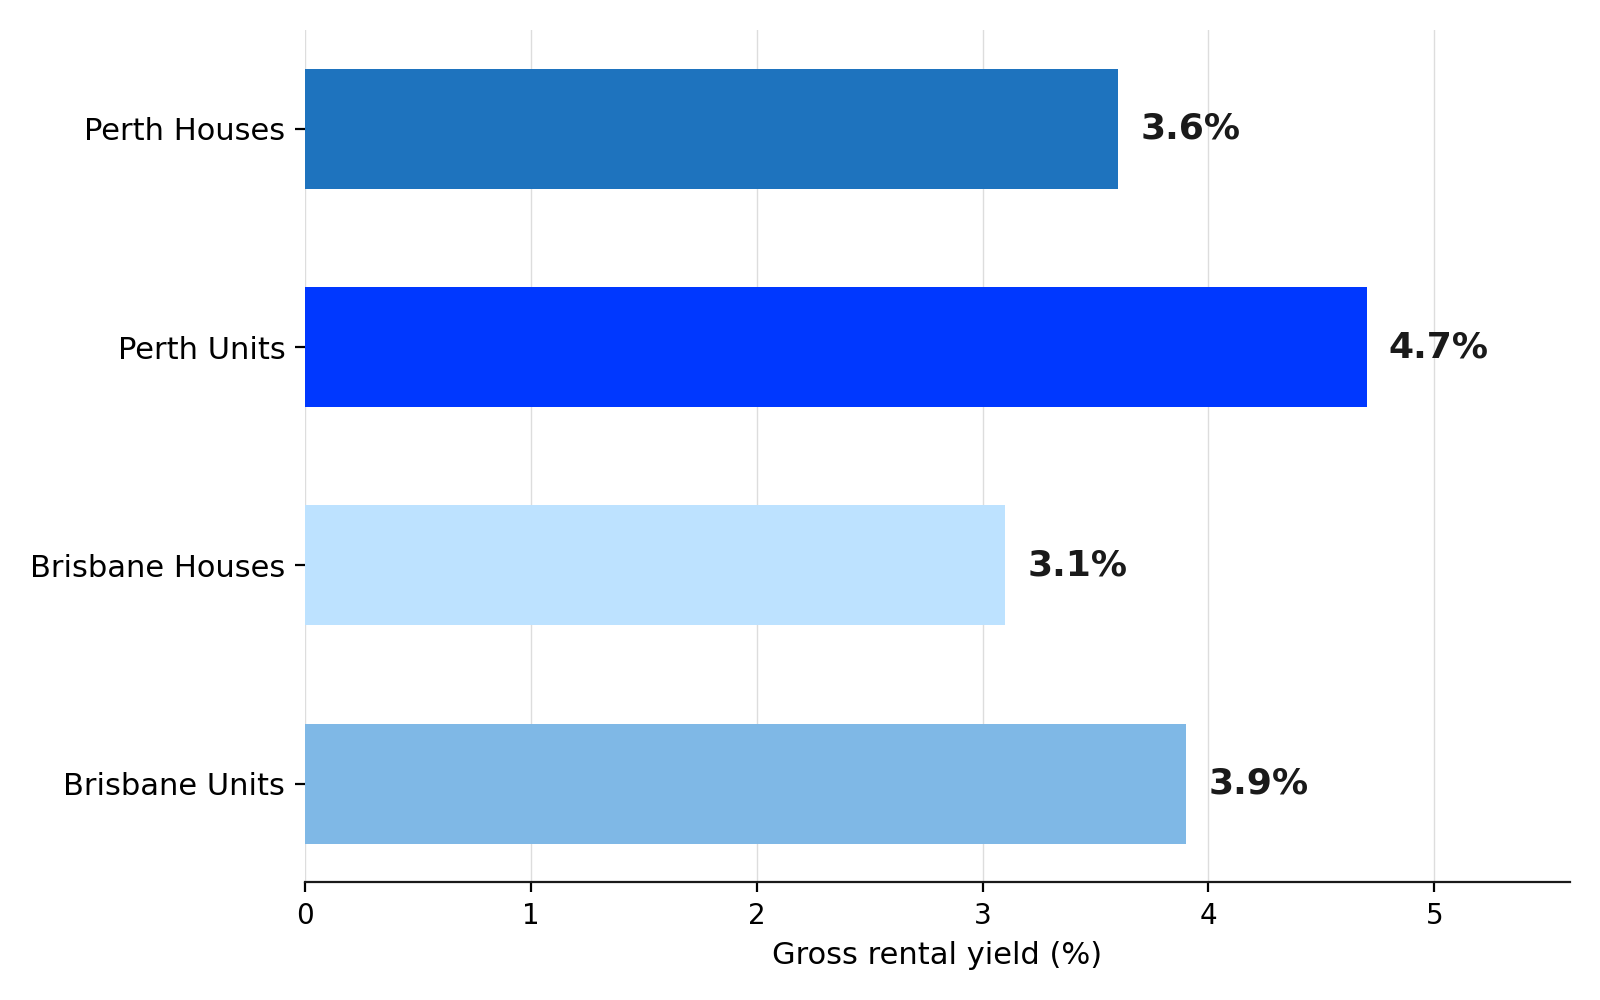
Perth delivers stronger income return alongside its growth, with gross yields of 3.6 percent on houses and 4.7 percent on units. Brisbane trails on yield at 3.1 percent for houses and 3.9 percent for units, a direct result of prices rising faster than rents over the past two years.
Gross Rental Yield Comparison: Perth vs Brisbane
Source: Cotality Home Value Index, 2026
Investors weighing this trade off should think in terms of yield versus growth rather than assuming one city wins outright. A growth focused investor with a longer time horizon may still prefer Brisbane's infrastructure story even at a lower yield.
Perth vs Brisbane: Affordability and Borrowing Power
Brisbane's higher median price directly reduces borrowing headroom for the same income and deposit. A buyer needs a larger deposit to hold the same loan to value ratio, and lenders assess the higher loan amount against their debt to income ratio, which can cap what an investor is approved for well before the property itself becomes the constraint.
Perth's lower entry price gives first time investors more room, though its price to income ratio has climbed from 5.8x in 2023 to 6.4x in 2025 as prices have outpaced wages. That is still below Sydney and Melbourne, but it signals affordability pressure is building, not absent.
Population Growth and Infrastructure Driving Demand
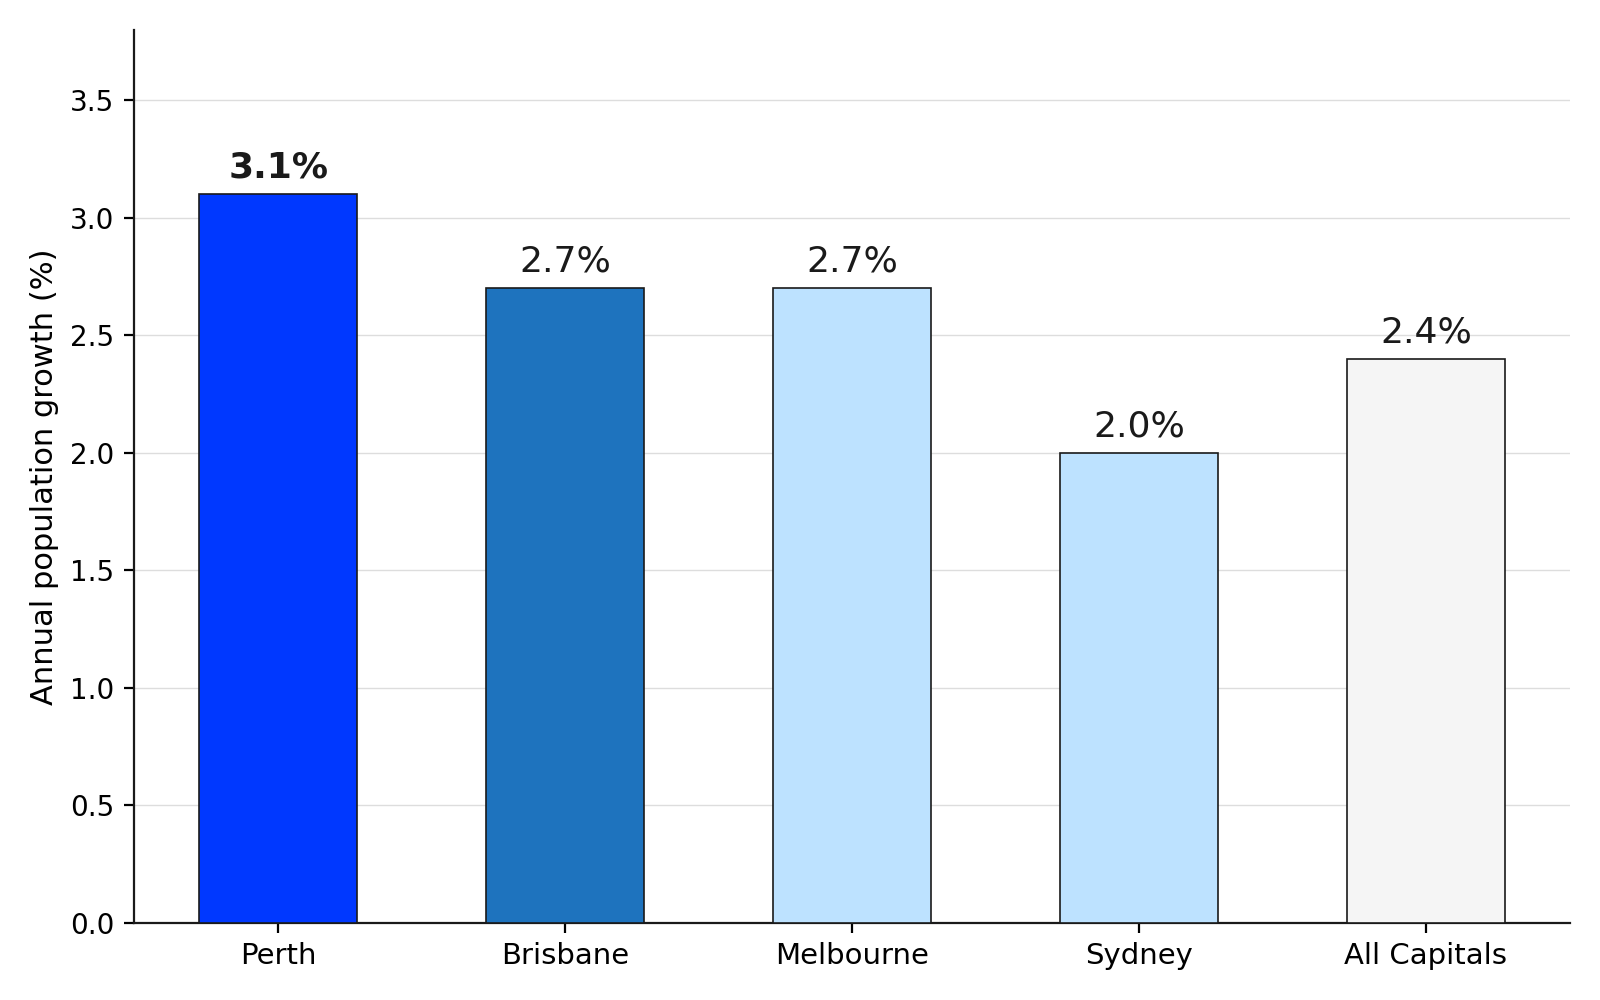
Perth recorded the highest population growth rate of any Australian capital in the 2023 to 2024 financial year at 3.1 percent, ahead of Brisbane's 2.7 percent and well above the national capital city average of 2.4 percent. Both cities are growing faster than Sydney and Melbourne, which underpins demand in both markets.
Annual Population Growth Rate by Capital City
Source: Australian Bureau of Statistics, 2025
Brisbane's growth is increasingly tied to confirmed infrastructure spending ahead of the 2032 Olympics, which tends to support planning certainty and construction activity in specific corridors. Perth's growth is more resource sector driven, which has historically been more cyclical than Brisbane's broader economic base.
Risks to Consider in Each Market
Perth's main risk is a cooling cycle. The market has posted five-year growth of 89.6 percent and ten-year growth of 109.4 percent, and cycles this strong have historically moderated once affordability limits are reached. A 2025 survey found 24 percent of new Perth borrowers were already spending more than 35 percent of income on repayments.
Brisbane's main risk is yield compression continuing alongside a high entry price, which leaves less room for error if interest rates move against holders. Both cities remain sensitive to further rate changes, and neither should be assessed on price momentum alone without checking the numbers against common property investment mistakes first time investors make.
Which Market Suits Your Investment Strategy?
The right market depends more on investor type than on which city is currently ahead. The comparison below reflects how each strategy is typically better served.
Working out what makes a good investment property for your situation matters more than the city label. The same logic applies to choosing investment grade suburbs within whichever city fits, since performance varies significantly between suburbs in both markets.
Both cities sit within a broader property investment landscape where the individual investor's borrowing position, timeframe and risk tolerance matter as much as the market itself.
Final Thoughts
Perth and Brisbane are both outperforming the rest of the country, but for different reasons. Perth is faster and pays a stronger yield today, while Brisbane costs more to enter and offers a longer, infrastructure backed growth story.
Neither the Perth property market nor Brisbane's is the automatically correct choice. The right one depends on the deposit an investor is working with, how much yield they need to service the loan, and how long they intend to hold. Matching the market to the strategy will always outperform matching the strategy to whichever market is making headlines.
Frequently Asked Questions
Recommended Reading
Two pages selected based on what readers of this article are most likely to need next.
Recommended Video
Most investors are still positioned in capital cities — but in 2026, that allocation gap is creating real opportunity cost. In a market where timing, positioning, and yield profiles compound into long-term outcomes, that disconnect matters more than most people realize.