

Rental Vacancy Rates: Best Suburbs for Reliable Rental Income
The suburbs offering the most reliable rental income in Australia share one thing in common: vacancy rates sitting well below 1%. As of mid-2026, every capital city is recording vacancy below 2%, but Perth, Adelaide, Brisbane, and Darwin are in a different league, with some sitting at 0.3% to 0.7%. This level of tightness reflects persistent rental demand that is structural, not seasonal.
But vacancy rate alone does not guarantee a sound investment. The cities recording the tightest vacancy are also showing the fastest rent growth, which tells one story. What they do not tell you is whether the yields still work at current prices, or whether the supply pipeline is about to close that gap.
The suburbs worth targeting now are the ones where both sides of that equation still hold, and understanding how to read property investment in Australia starts with knowing where the numbers are genuinely in your favour.
What Are Rental Vacancy Rates?
A rental vacancy rate is the percentage of rental properties sitting empty at any given time. If there are 1,000 rental properties in a suburb and 10 are vacant, the vacancy rate is 1%. It sounds simple, but its implications for property investment are layered and frequently misunderstood by investors who focus almost exclusively on purchase price and growth projections.
How Vacancy Rates Are Calculated
SQM Research, one of Australia's most widely cited data providers, tracks online rental listings that have been advertised for three weeks or more against the total count of established rental properties. This methodology filters out newly listed stock that has not yet tested the market, producing a more reliable signal than raw listing counts or agency surveys alone.
Why Investors Monitor Vacancy Rates
When vacancy is low, demand exceeds supply. Landlords can command higher rents, experience shorter void periods, and hold stronger negotiating power when leases come up for renewal. It is one of the earliest indicators of whether a suburb is entering a demand cycle or coming off the back of one.
What Is a Good Rental Vacancy Rate for Investors?
Not all low vacancy rates signal the same thing. Where a rate sits on the scale tells you a fundamentally different story about the market's structural health.
Below 1%: Acute Shortage
Perth recorded 0.5% vacancy in April 2026. Adelaide sat at 0.7% in the same period. At these levels, most properties are filled within days of listing, and tenants have almost no negotiating power over rental price or lease terms. For investors, this is as close to guaranteed occupancy as a rental market can produce.
Between 1% and 2%: Tight and Investor-Favourable
Brisbane has ranged between 0.6% and 0.9% through 2026. This still represents a strongly landlord-favoured market with consistent rent growth and low void risk. It is also the range where most robust investment cases are made, because the tightness is real but not so extreme that rent growth has already outrun affordability.
When Very Low Vacancy Becomes a Warning Sign
Ultra-tight vacancy does not automatically mean the investment will perform. A suburb at 0.4% vacancy with a declining population tells a different story from one at 0.4% vacancy with a $1.2 billion hospital under construction and rising interstate migration. The number always needs context before it means anything to your strategy.
FOR EXAMPLE
Consider two suburbs both recording 0.8% vacancy. Suburb A has a strong employment base, interstate migration, and a supply pipeline running 18 months behind household formation. Suburb B is a beachside town where vacancy drops in summer as holiday-let stock returns to long-term listings and climbs again in winter. Same number. Completely different risk profiles.
Australian Rental Vacancy Rates by City in 2026
Every Australian capital city recorded vacancy below 2% through the first half of 2026, according to SQM Research. But the range between cities is wide enough to matter significantly for investment decisions.
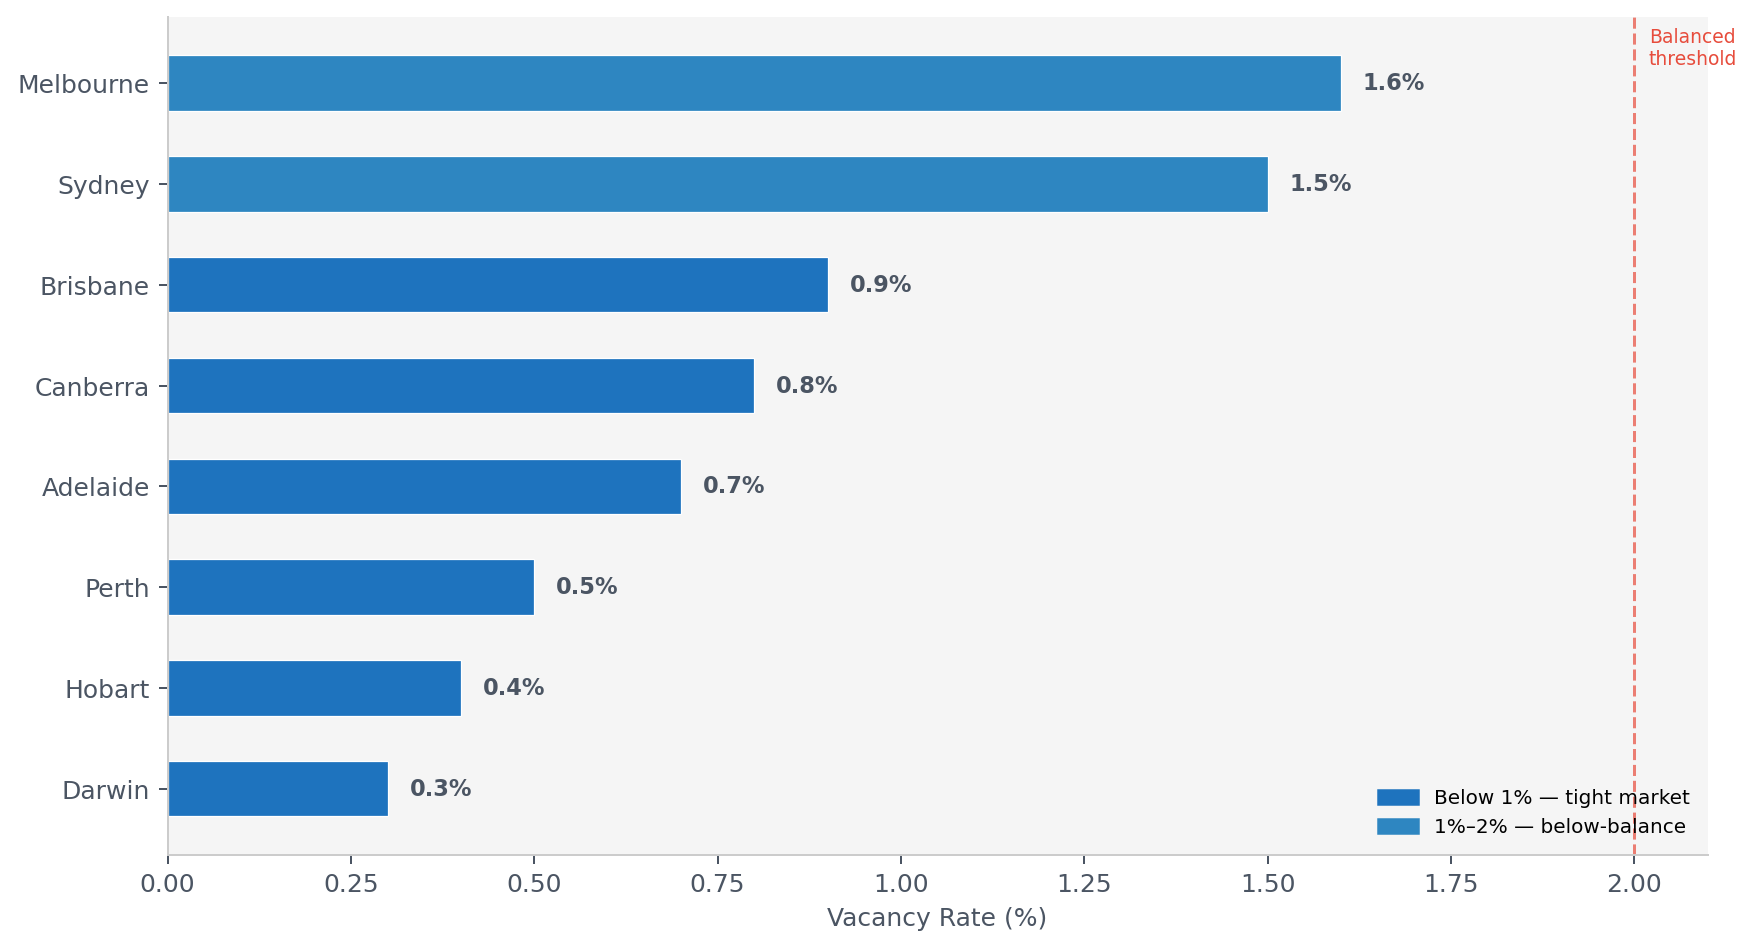
Source: SQM Research, April-May 2026. Darwin and Hobart data: SQM Research, April 2026. Canberra data: Domain Rental Report, March 2026.
Perth: Record-Low Vacancy, Strong Rent Rebound
Perth recorded 0.5% vacancy in April 2026, with fewer than 1,100 available rentals across the metro. The Domain Rental Report for March 2026 placed the vacancy rate at 0.3%, its lowest recorded level.
House rents jumped 5.7% in the March 2026 quarter, the strongest quarterly lift of any capital city. The market is tight, and the rental yields in Perth compared to Brisbane remain competitive at 4.3% on houses, which is meaningfully above Sydney and Melbourne.
Adelaide: Sustained Constraint Over 18 Months
Adelaide has maintained vacancy below 1% for over 18 consecutive months. The Domain report placed it at 0.4% in March 2026 and SQM Research at 0.7% in April. Northern corridor suburbs including Salisbury, Andrews Farm, and Elizabeth South continue to offer gross yields above 5% with vacancy below 1.5%, a combination that is difficult to find in Sydney or Melbourne at any price point.
Adelaide also forms part of the strong three-city investment case across Brisbane, Adelaide, and Perth that has dominated investor conversations in 2025 and 2026.
Brisbane: Consistent Tightness with Olympic Tailwind
Brisbane's vacancy rate reached 0.6% in March 2026, its lowest reading since Domain records began, before a small seasonal lift to 0.9% by May 2026. The underlying dynamic has not changed.
Inner and middle-ring suburbs are fully landlord-favoured, and the housing shortage in Australia is hitting Brisbane harder than most, with completions running well behind household formation. Brisbane units recorded 4.3% quarterly rent growth in March 2026, driven by the Olympic infrastructure pipeline and continued interstate migration from Sydney and Melbourne.
Sydney and Melbourne: Tight but Affordability-Constrained
Sydney sat at 1.5% and Melbourne at 1.6% as of May 2026, both well below the pre-COVID balanced range but notably higher than the three cities above.
Sydney's median house rent reached $824 per week in Q1 2026 (Cotality), which means the affordability ceiling is already biting into effective tenant demand in many suburbs. Vacancy can stay relatively low even as rent growth slows when tenants simply cannot afford to move.
City-Level Comparison (April–May 2026):
Source: Cotality Rental Review Q1 2026, Domain Rental Report March 2026, SQM Research May 2026.
How to Use Rental Vacancy Rates When Choosing a Suburb
Vacancy rate is a filter, not a final answer. Investors who lead with vacancy data and stop there are making the same analytical mistake as investors who lead with median price and stop there.
The best decisions layer vacancy over several other signals. Choosing investment-grade suburbs requires a framework that treats vacancy as one input among many, not the deciding factor on its own.
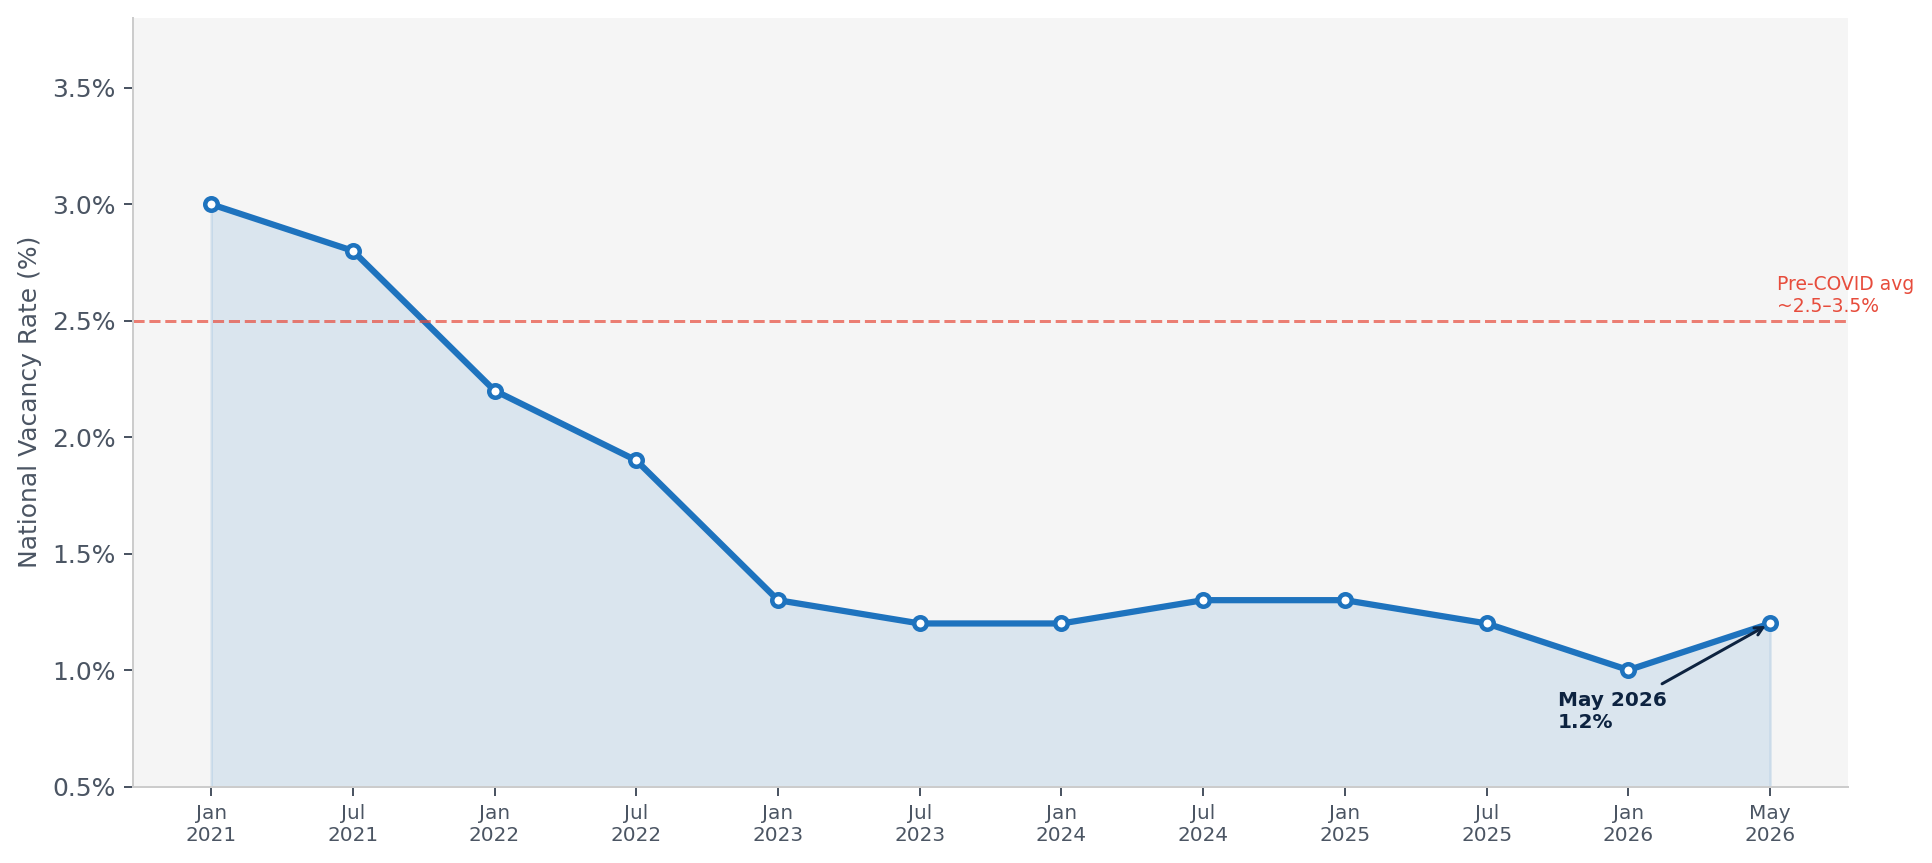
Source: SQM Research. Historical data (2021-2025) sourced from SQM Research monthly bulletin series. Pre-COVID balanced-market average reference: SQM Research, Property Update. 2026 data points: SQM Research monthly bulletins.
Population Growth and Infrastructure
Suburbs where population growth is absorbing new rental stock consistently outperform on both yield sustainability and capital growth. Infrastructure announcements, particularly transport links, hospitals, and schools, are structural drivers of rental demand that vacancy rates alone do not capture. A suburb with sub-1% vacancy and a new metro station under construction is a meaningfully different investment from one with the same vacancy figure and no planned investment.
Rental Yield and Affordability
A 0.5% vacancy rate is compelling data. But if the entry price has already risen to the point where gross yield sits below 3.5%, the cash flow case weakens quickly, especially when investor mortgage rates remain above 6%. Understanding your borrowing capacity formula is part of this equation, because a property that looks affordable on yield may still be unsustainable if the repayments do not work relative to your actual borrowing position. The balance between yield versus capital growth is one of the most important framework questions in any suburb selection decision.
The Supply Pipeline
Even the tightest vacancy rate can be unwound within two to three years if a significant apartment pipeline is approved in that suburb.
Always cross-reference vacancy data with building approvals and development applications. A suburb with 0.8% vacancy and a new 300-unit development approved may look structurally different in 36 months, and the yield compression can begin well before those apartments are completed.
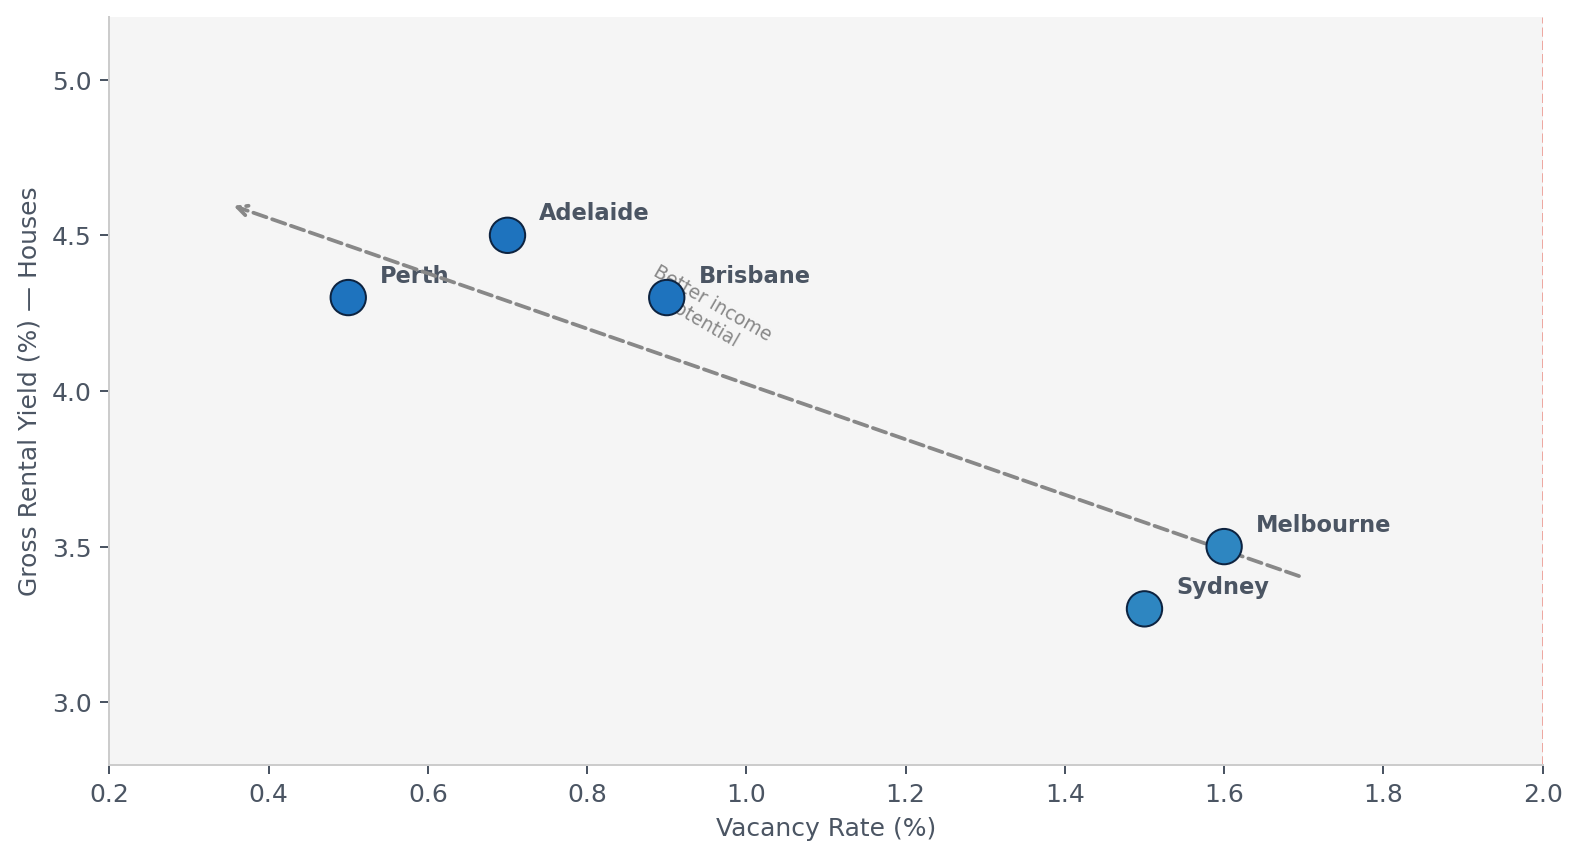
Source: Chart compiled from Cotality Rental Review Q1 2026 (rent data), Domain Rental Report March 2026 (vacancy data), and Australian Property Experts April 2026 (yield estimates). Gross yield is calculated on houses.
Common Mistakes Investors Make with Vacancy Data
Vacancy rate is one of the most misused metrics in property research. Knowing what not to do with the data is as important as knowing how to read it.
Chasing Vacancy Alone Without Checking the Yield
Buying in a low-vacancy suburb without verifying the yield, purchase price, and capital growth trajectory is one of the most common first-time investor errors. This is the property equivalent of buying a stock because everyone else is buying it rather than because the underlying fundamentals are sound.
The most common property investment mistakes almost always involve acting on one data point in isolation.
Ignoring Owner-Occupier Demand in the Suburb
Markets driven by strong owner-occupier demand tend to hold value better through economic downturns than purely rental-reliant markets.
A suburb where most tenants would buy if they could is generally a more resilient long-term hold than one where tenants have no aspiration toward ownership. Vacancy may be low in both, but the capital growth trajectory is usually different.
Confusing Tight Vacancy with Guaranteed Rent Growth
National rents rose 7.8% year-on-year as of mid-2026 (SQM Research). But that average includes markets where rent growth is already plateauing at the affordability ceiling.
Vacancy can remain low even as rent growth slows, because tenants are priced in and cannot afford to leave. That is a very different dynamic from vacancy staying low because more tenants are actively competing to enter the market.
FOR EXAMPLE
In parts of inner Sydney through 2026, vacancy has stayed below 1.5% while some landlords have encountered resistance at renewal time, with tenants negotiating rather than accepting increases. Tight vacancy does not mean unlimited rent growth when affordability is already fully stretched. The mechanism driving tightness matters.
Final Thoughts
Australia's rental vacancy rate of 1.2% nationally in mid-2026 confirms the market is structurally undersupplied. But it does not tell you which suburb to buy in, what yield is achievable at current entry prices, or whether the numbers will hold over your intended hold period.
Perth, Adelaide, and Brisbane stand out for combining tight vacancy with accessible yields and demographic tailwinds that are not yet fully priced into every suburb in those cities.
Sydney and Melbourne remain undersupplied too, but the entry prices in those markets require more careful scrutiny of the cash flow case and how rental income interacts with your borrowing capacity before committing.
The investors who consistently find properties that perform over a 10 to 15-year hold are the ones who treat vacancy as one filter in a broader analytical framework. Not the whole answer. The starting point.
Frequently Asked Questions
Recommended Reading
Two pages selected based on what readers of this article are most likely to need next.
Recommended Video
Most buyers think success comes from timing the market, but the real difference between people who build wealth and people who get stuck comes from buying the right asset with the right strategy, structure and support.