

We Analysed 10 Years of Data on Australia's Growth Suburbs. Here's What We Found Out.
Australia's strongest capital growth over the past decade wasn't spread evenly across cities, and it wasn't the suburbs most investors were watching either.
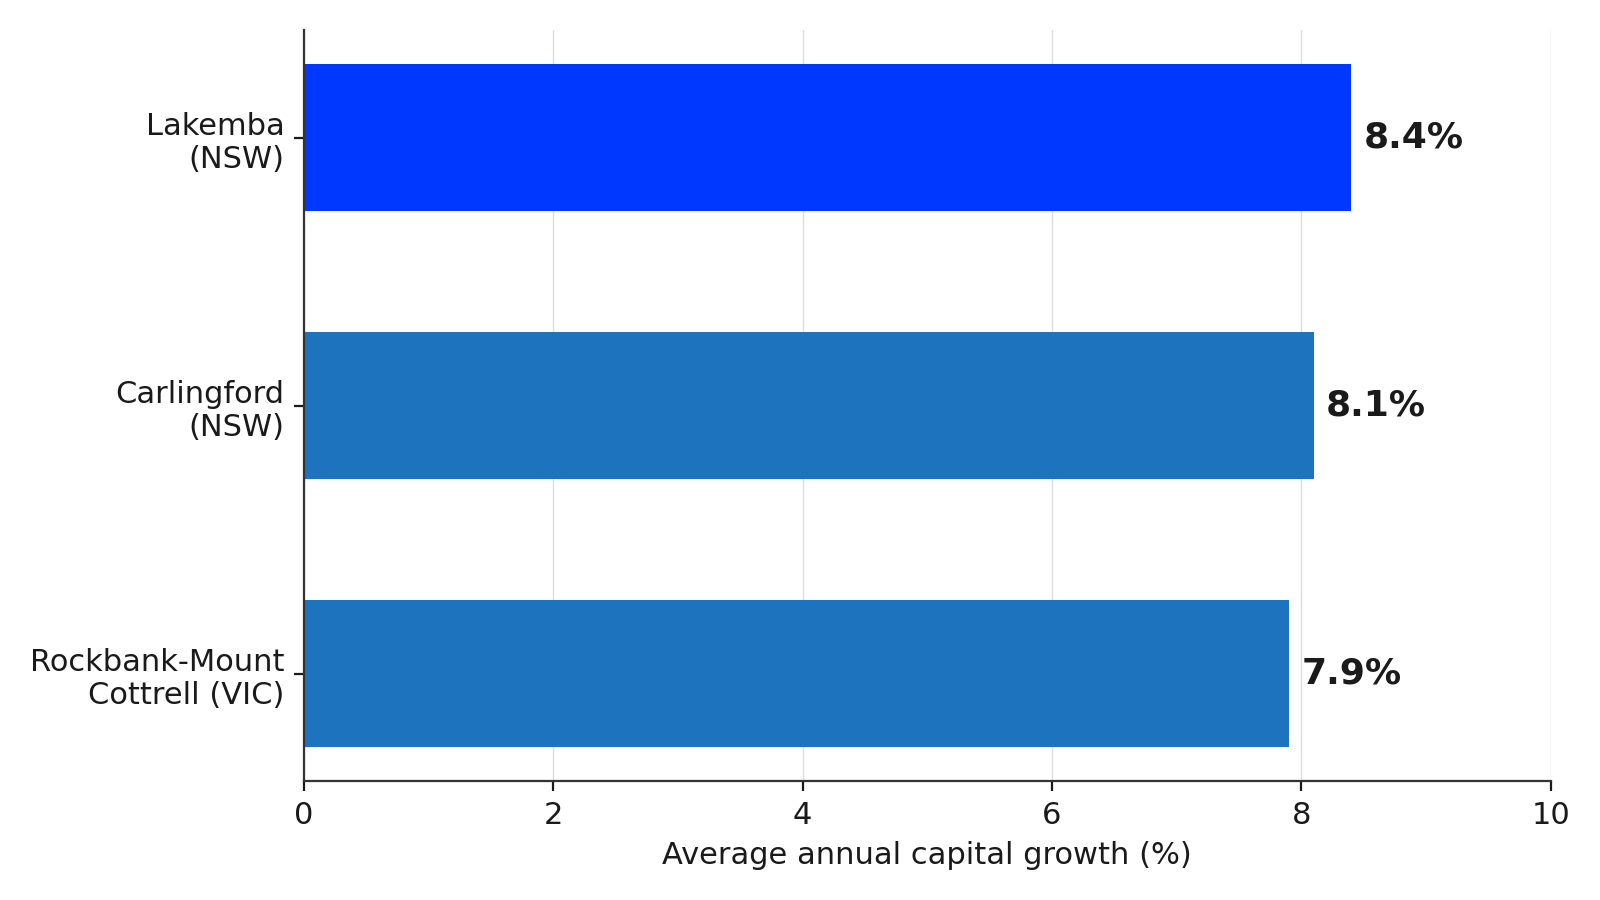
It was concentrated in a handful of pockets that quietly outperformed everywhere else. Lakemba in Sydney's Canterbury district was the frontrunner. CoreLogic and the Property Investment Professionals of Australia recorded average annual growth of 8.4 per cent there, more than doubling the suburb's median house value to about $881,000. Carlingford followed close behind, posting close to 8 per cent annual growth over the same period.
What drove that outperformance has less to do with picking the right city and more to do with spotting the pockets within it where demand consistently outran supply, long before the growth numbers made headlines. Before targeting a similar suburb today, it helps to understand what created that gap, and whether your borrowing capacity puts you in a position to act on it.
Which Suburbs Delivered the Strongest Capital Growth Over the Past Decade?
Lakemba, in Sydney's Canterbury region, topped the national list. Its median house value climbed to about $881,000 over ten years, an average annual gain of 8.4 per cent according to the joint CoreLogic and PIPA research, more than doubling in that time.
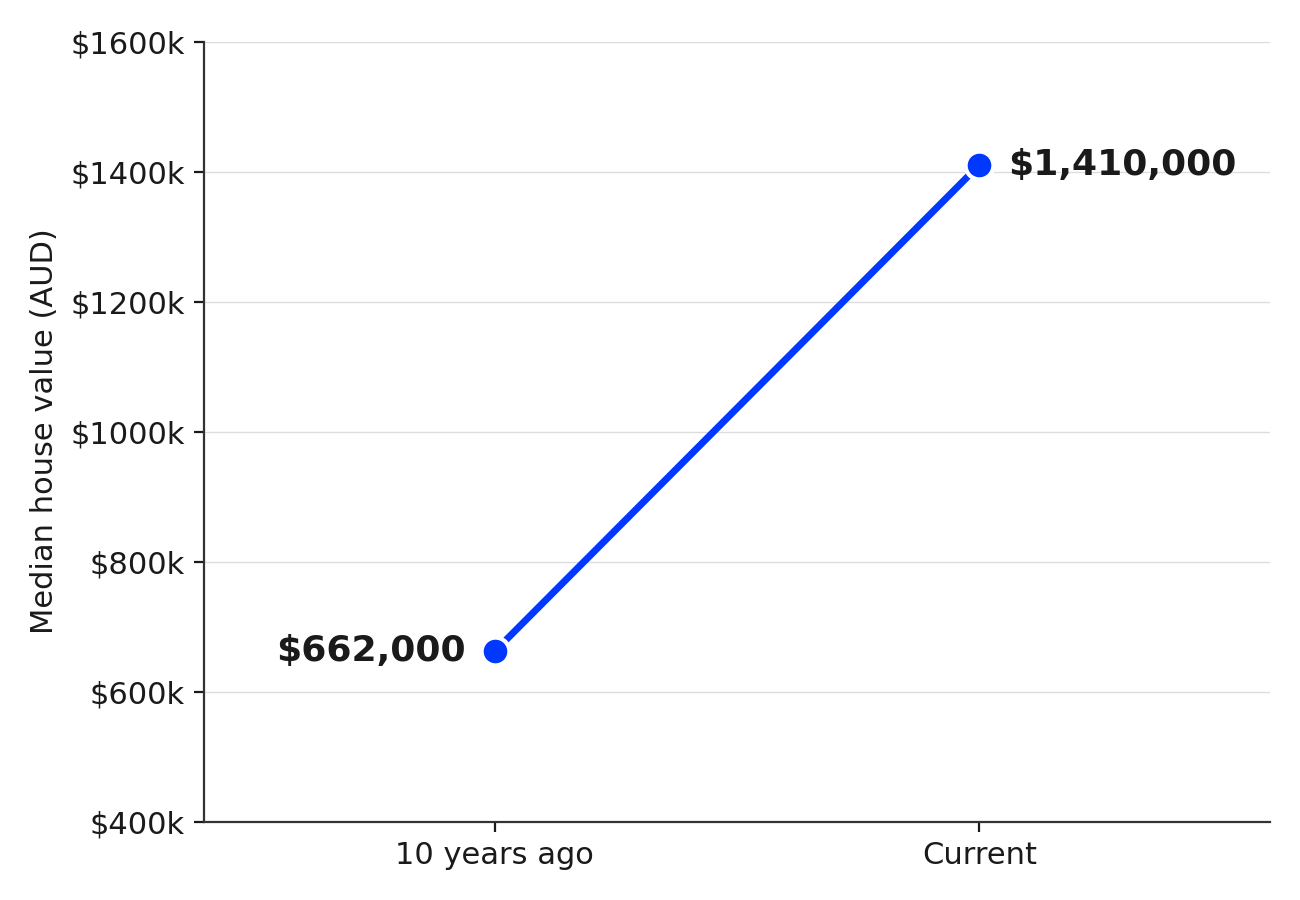
Carlingford, in the Oatlands-Dundas Valley pocket of Sydney, ranked second at 8.1 per cent a year. Its median house value rose from $662,000 to $1.41 million, more than doubling in dollar terms over the same window.
Rockbank-Mount Cottrell, on Melbourne's western fringe, rounded out the top three at 7.9 per cent annually. Its median climbed from around $280,000 to close to $600,000, more than doubling despite starting from a far more affordable base.
Australia's Top Three Suburbs for Decade Capital Growth
Source: PIPA and CoreLogic, decade suburb performance research
How Consistent Was Growth Across Australia's Capital Cities?
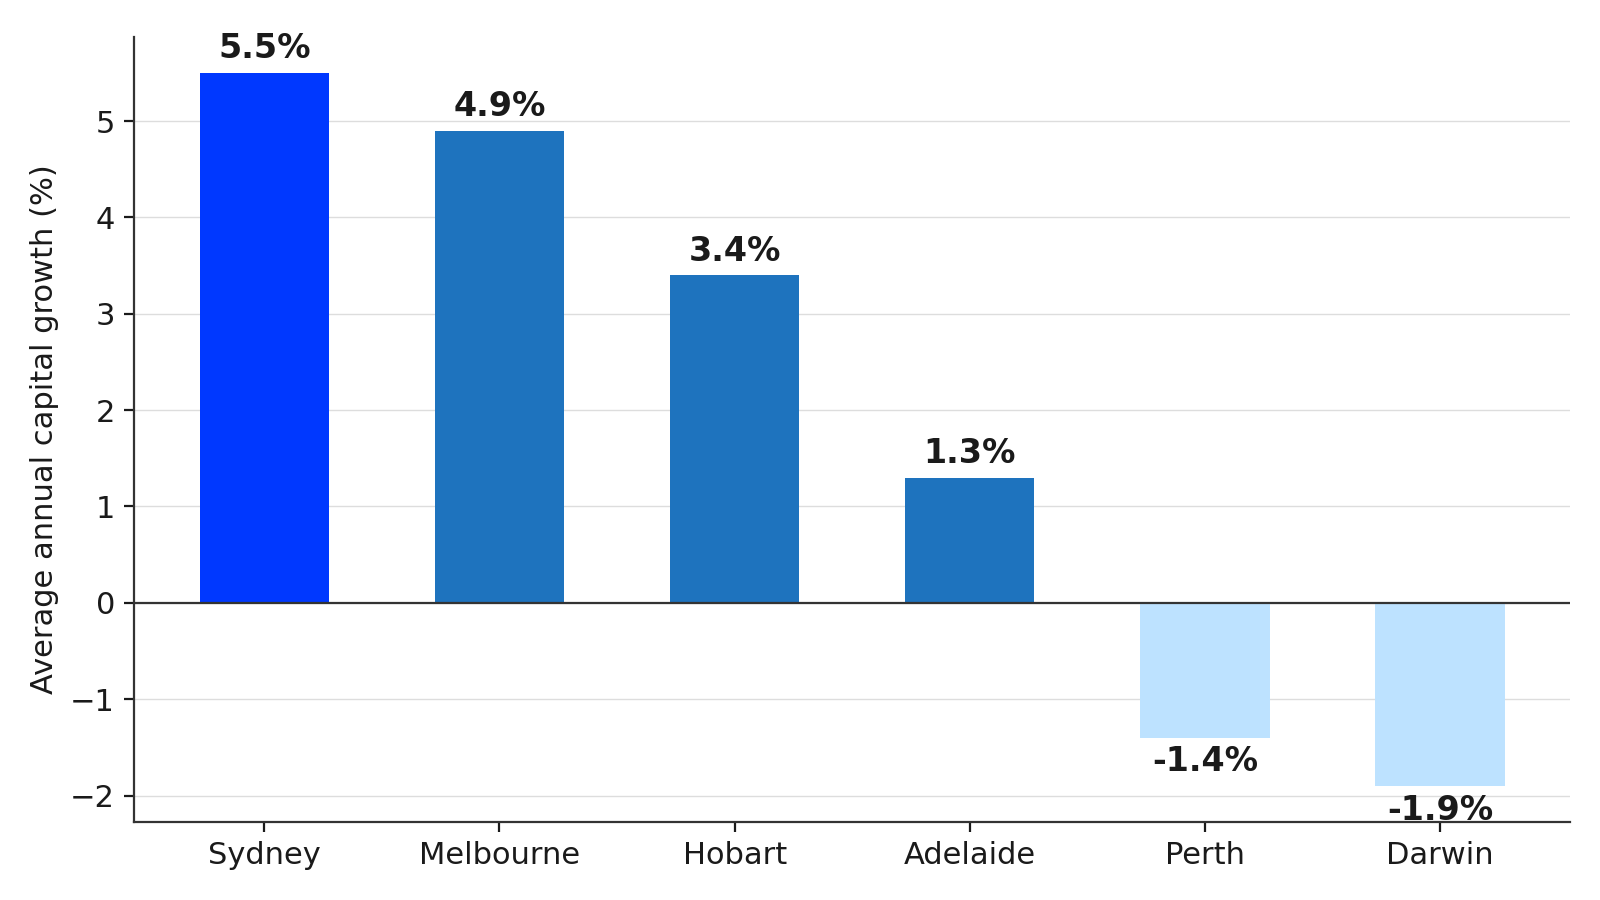
City averages tell a very different story to individual suburb winners. Sydney recorded the highest average annual capital growth of any capital city over the decade, at 5.5 per cent, with Melbourne close behind at 4.9 per cent.
Hobart and Adelaide posted modest single digit growth over the same period. Perth and Darwin recorded negative average annual growth, at negative 1.4 per cent and negative 1.9 per cent respectively, a reminder that growth is never guaranteed at the city level.
Even inside weaker cities, individual suburbs bucked the trend. In Adelaide, where the city averaged 1.3 per cent annually, Prospect delivered 3.4 per cent. In Darwin, where prices fell on average, Rosebery-Bellamack still gained 3.2 per cent a year. That gap between a city's average and its best submarket is exactly why suburb selection research beats relying on city level headlines alone.
Average Annual Capital Growth by Capital City, Past Decade
Source: CoreLogic, decade capital city home value analysis
What Did the Strongest Capital Growth Suburbs Have in Common?
Every suburb in the national top three sat inside established, well connected metro areas rather than fringe developments with no infrastructure. Lakemba and Carlingford both benefit from rail access into Sydney's CBD, while Rockbank-Mount Cottrell forms part of Melbourne's fast growing western corridor.
None of the three had significant new land release competing with existing stock. Limited supply against rising population meant demand had to compete for a fixed number of established homes, which pushed prices up faster than construction could respond.
Each suburb also started the decade below its city's median, which widened the pool of buyers able to enter and compete for property there. That combination of transport access, constrained supply and an affordable entry point shows up repeatedly across Australia's best performing pockets, a dynamic also visible in the rental crisis data tightening across similar middle ring suburbs today.
Carlingford Median House Value, Decade Comparison
Source: PIPA and CoreLogic, decade suburb performance research
FOR EXAMPLE
Carlingford's median sat at $662,000 a decade ago, well under Sydney's citywide figure at the time. That affordability, combined with direct rail access, drew a wider pool of owner occupiers and investors, and prices responded.
Does Past Capital Growth Predict Future Property Performance?
Historical winners rarely repeat in the exact same order. CoreLogic's own research team has noted that the next decade's best performers are likely to look quite different from the last, in the same way mining towns and regional coastal markets once topped the growth tables before falling away.
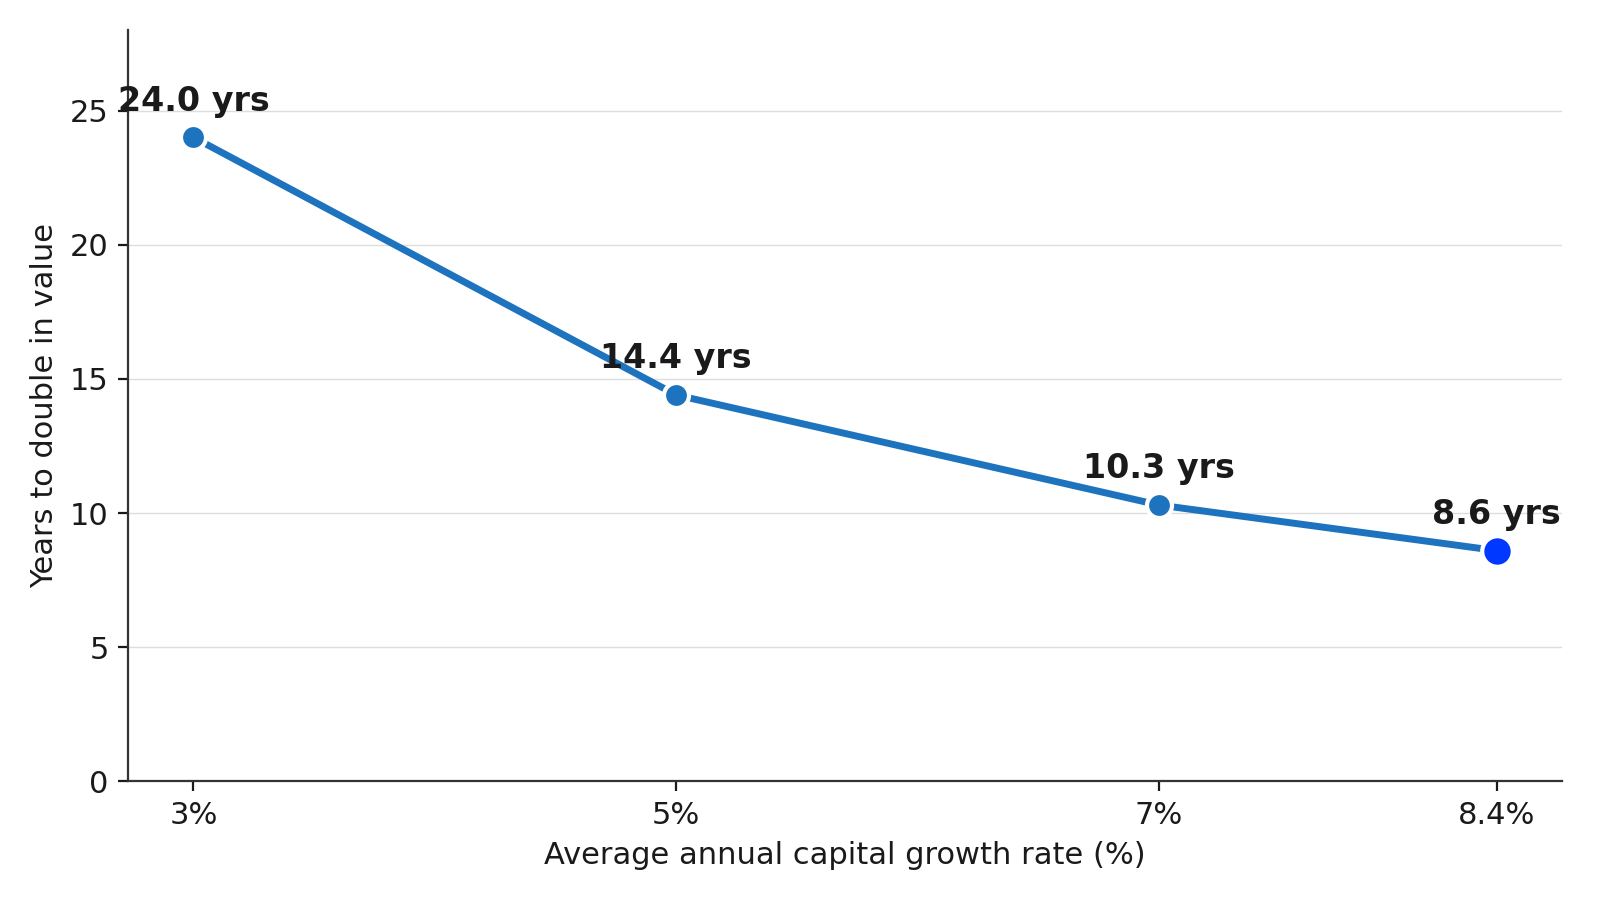
A useful rule of thumb ties directly back to the data above. Dividing 72 by an annual growth rate estimates how long it takes a property to double in value. Lakemba's 8.4 per cent implies doubling roughly every 8.6 years, while a more typical 5 per cent city average implies doubling every 14.4 years.
That framing matters because it separates realistic expectations from marketing hype. A suburb growing at 3 per cent a year will take 24 years to double, which changes the investment case considerably compared to a suburb growing at 7 or 8 per cent, and it should shape how you assess property investment mistakes before you commit to a purchase based on a single standout year.
How Growth Rate Changes the Time It Takes to Double in Value
Source: Rule of 72 calculation applied to CoreLogic decade growth data
How Can Investors Use Capital Growth Data When Choosing a Suburb?
Start with the fundamentals that drove the last decade's winners: transport access, constrained supply and an entry price below the city median. Suburbs meeting two or more of these criteria are worth deeper research, in the same way accidental investors often stumble into strong performing areas without realising why they worked.
Cross check growth potential against your own borrowing position before shortlisting anything. A suburb's momentum means little if your debt to income ratio limits what you can purchase there. It also pays to compare interstate options, since Brisbane, Adelaide and Perth are increasingly where analysts expect the next growth cycle to concentrate.
Finally, balance growth potential against cash flow. A suburb with strong capital growth but very low rental yield can strain your holding costs, which is why yield vs growth decisions should sit alongside any suburb shortlist, not after it. For a broader framework, FPW's property investment guide covers how to weigh these factors together.
Final Thoughts
A decade of CoreLogic and PIPA data confirms that Australia's strongest capital growth rarely follows the obvious path. Lakemba, Carlingford and Rockbank-Mount Cottrell outperformed not because they were expensive or well known, but because transport access, constrained supply and affordable entry prices aligned at the same time.
City averages remain useful context, but they can hide standout suburbs inside otherwise flat markets. Investors who study suburb level data, and pair it with a realistic view of borrowing capacity, are better placed to identify the next decade's outperformers rather than chasing the last one.
Frequently Asked Questions
Recommended Reading
Two pages selected based on what readers of this article are most likely to need next.
Recommended Video
Most buyers think success comes from timing the market, but the real difference between people who build wealth and people who get stuck comes from buying the right asset with the right strategy, structure and support.