

Negative Gearing Changes 2027: These Suburbs Don't Care

Most coverage of the 2027 negative gearing reforms asks which suburbs will feel the most pain. That is a reasonable question. But the more useful one for an investor today is which suburbs will barely notice — and the data makes the answer surprisingly clear.
The reform only bites when a property is running at a rental loss. If rental income already covers holding costs, there is no loss to quarantine. No loss, no problem. That one mechanical reality means an entire category of suburb sits almost entirely outside the reform's reach, and most investors haven't started mapping their strategy around it yet.
Understanding that category starts with yield, not prestige.
What Makes a Suburb Reform-Proof?
Negative gearing works by offsetting a rental loss against your wages or salary income. From 1 July 2027, that offset disappears for established properties bought after Budget night, 12 May 2026. Losses can still be carried forward against future investment income, just not against your pay packet.
The critical word there is loss. The reform only creates a problem when rental income falls short of holding costs. A property already generating more rent than it costs to hold has no loss. Nothing to quarantine. The policy change is, structurally speaking, irrelevant to it.
That is not a loophole. It is just how the math works.
Most analysts treat 6% gross yield as the rough cash flow breakeven once you account for a standard variable mortgage rate, insurance, council rates, management fees, and maintenance. Properties clearing that threshold comfortably are already in territory where the negative gearing deduction was never doing much heavy lifting anyway.
The question is which suburbs consistently post yields in that range and why most investors in those markets were building wealth through cash flow and growth rather than a tax offset.
The Suburbs That Don't Care: Real Data
The suburbs sitting furthest from the reform's reach are not the ones you see in weekend property supplements. They are spread across regional Western Australia, inland Queensland, the Northern Territory, and pockets of outer metro Perth. What they share is rental demand that outruns the property valuation, which is precisely what keeps yields above breakeven.
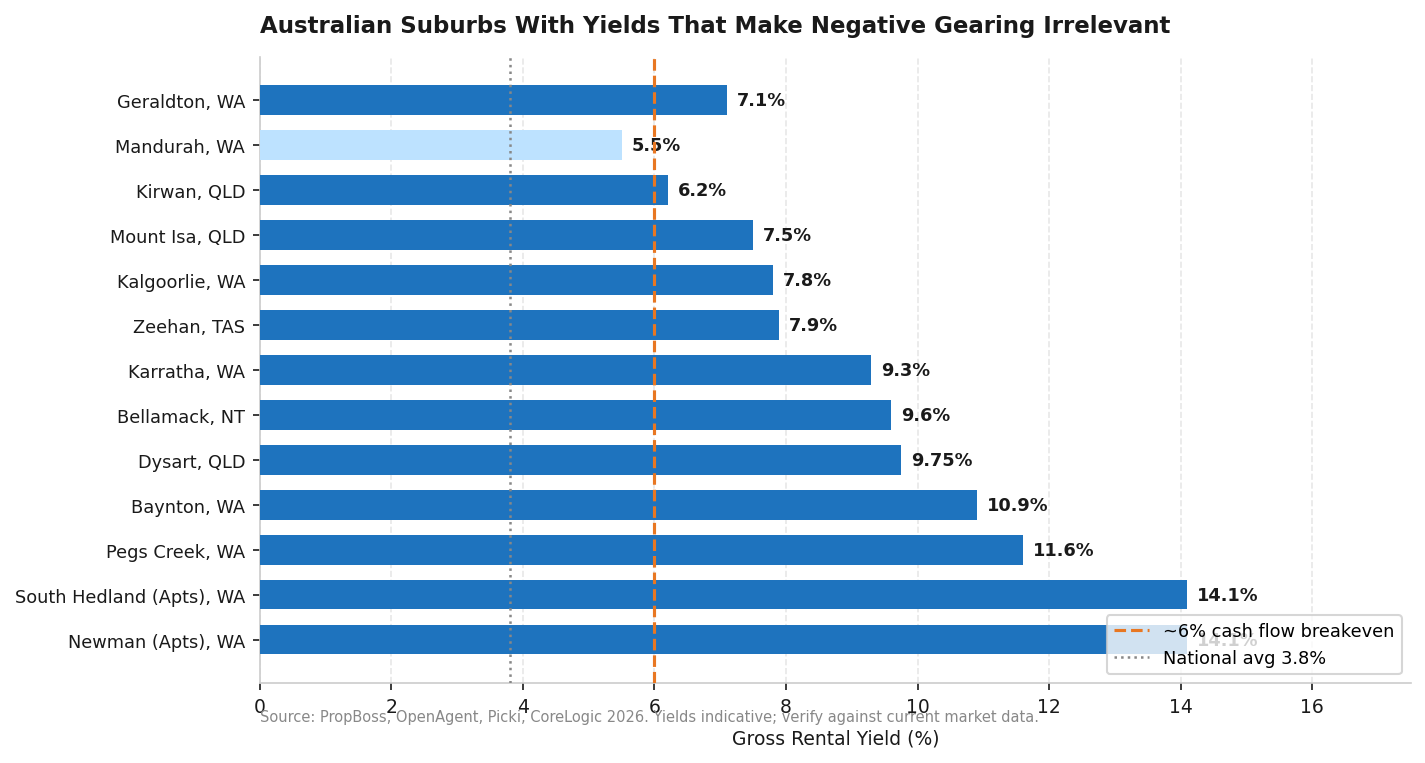
Chart 1: Australian Suburbs with Yields That Make Negative Gearing Irrelevant
Source: PropBoss, OpenAgent, Picki, CoreLogic 2026. Yields indicative; verify against current market data.
Western Australia: The Yield Leader
Western Australia dominates the top of any Australian yield table, and the numbers are not close. South Hedland apartments post a 14.1% gross yield on a $310,000 median with $838 per week median rent. Newman apartments match that figure on a $225,000 median and $610 per week rent.
Pegs Creek, near Karratha, runs at 11.6% for houses and 10.2% for apartments. Baynton reaches 10.9% for houses. Karratha itself posts 9.3% on a $420,000 median with $750 per week rents. These are Pilbara property investment markets driven by FIFO mining workforces and structurally thin housing supply.
Step down slightly in WA and you still clear breakeven. Kalgoorlie (Goldfields) sits at 7.8% with houses under $320,000. This is more stable than the Pilbara because gold mining is more predictable than bulk iron ore cycles. Geraldton regularly exceeds 7% with better capital growth prospects than the deep regional towns.
Even Mandurah, an outer Perth market with genuine liquidity and population growth, sits in the 5% to 6% range. Not spectacularly high, but enough that investors in the right stock are already cash flow neutral or better, which means they were never dependent on the wage offset to hold. The Perth property market is running a 4.1% average yield on houses, but the outer fringe regularly outperforms that figure.
Queensland: The Consistent Alternative
Regional Queensland offers something WA mining towns cannot always match: diversified employment. The Townsville, Mackay, Cairns, and Rockhampton markets are backed by defence, healthcare, agriculture, and education, not a single commodity cycle.
Mount Isa leads at 10.4% gross yield on a $210,000 median. Dysart (Bowen Basin coal region) sits at 9.75%. Kirwan in Townsville runs at 6.2%, backed by the Lavarack Barracks defence precinct, James Cook University, and a regional hospital. Vacancy rates in Kirwan have been below 1.5% for extended periods, which is what supports yield figures rather than just flattering them.
Broader Townsville, Cairns, Mackay, and Rockhampton show gross yields between 5.5% and 8.5% across houses under $550,000. Rents in these markets lifted 15% to 25% over three years without a corresponding price surge, which widened yield margins considerably. The rental vacancy rates in most of these markets are genuine, around sub-1.5% in the best-performing suburbs.
Northern Territory and Tasmania
Darwin is the strongest capital city for yield in the country, running a 6.3% average for houses and 7.2% for apartment units. Bellamack in Darwin's outer ring posts 9.6% gross yield. These figures reflect Darwin's structural dynamic: a transient defence, public service, and resources workforce that rents rather than owns, in a city where property prices have stayed flat while rents firmed significantly.
Tasmania's west coast is small but notable. Zeehan reaches 7.9% and Queenstown 7.4%, both with medians under $235,000. These are illiquid markets where vacancy can spike, but for investors who understand the risk, the yield is genuine and the reform exposure is essentially zero.

Negative Gearing Property Investment: Which Suburbs Are Most Exposed?
The 2026-27 Federal Budget confirmed that from 1 July 2027, rental losses on established properties bought after Budget night cannot be deducted against wages or salary. Properties bought before that date keep their existing arrangements in full under the negative gearing grandfathering rules.
A second change replaces the 50% capital gains tax discount with a CPI-indexed cost base and a minimum 30% tax on gains, also from 1 July 2027. Investors relying on the CGT grandfathering provisions for existing holdings should confirm exactly which properties qualify before assuming they are unaffected.
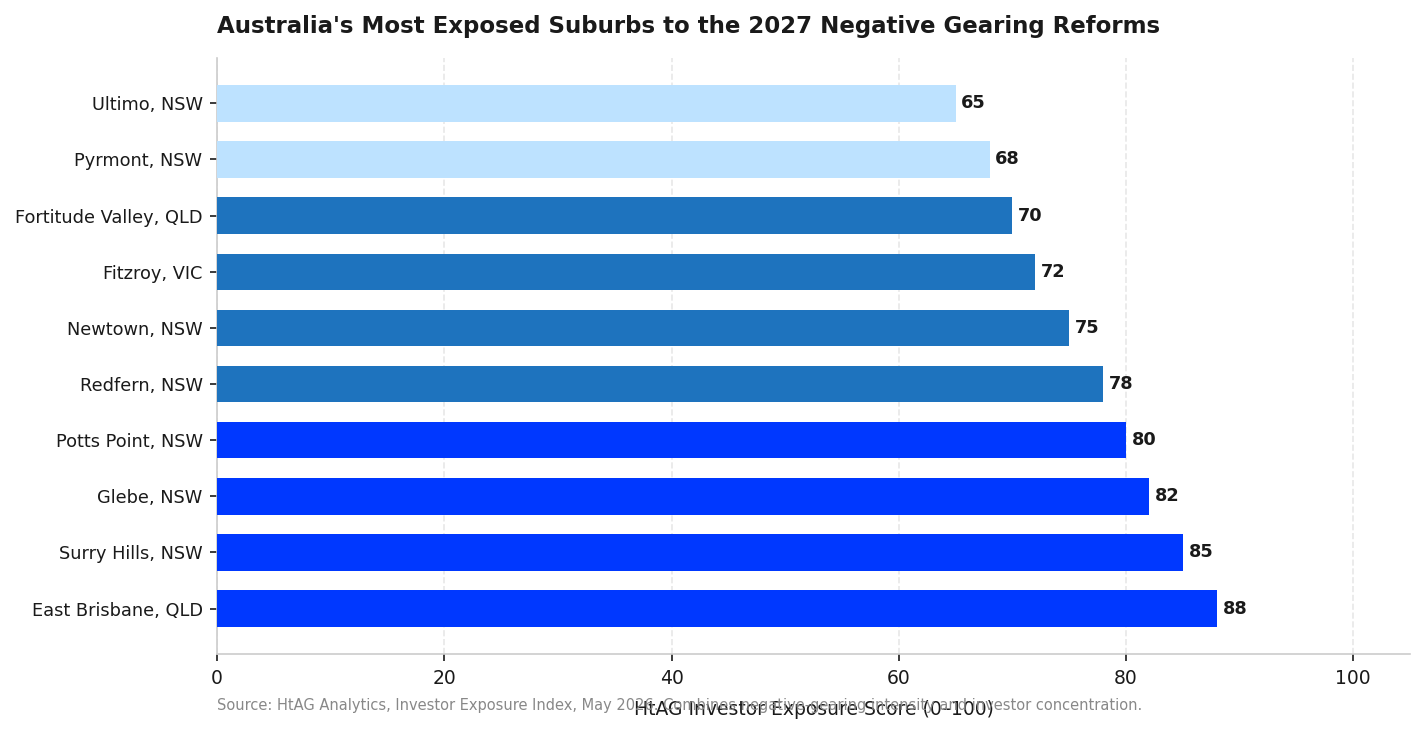
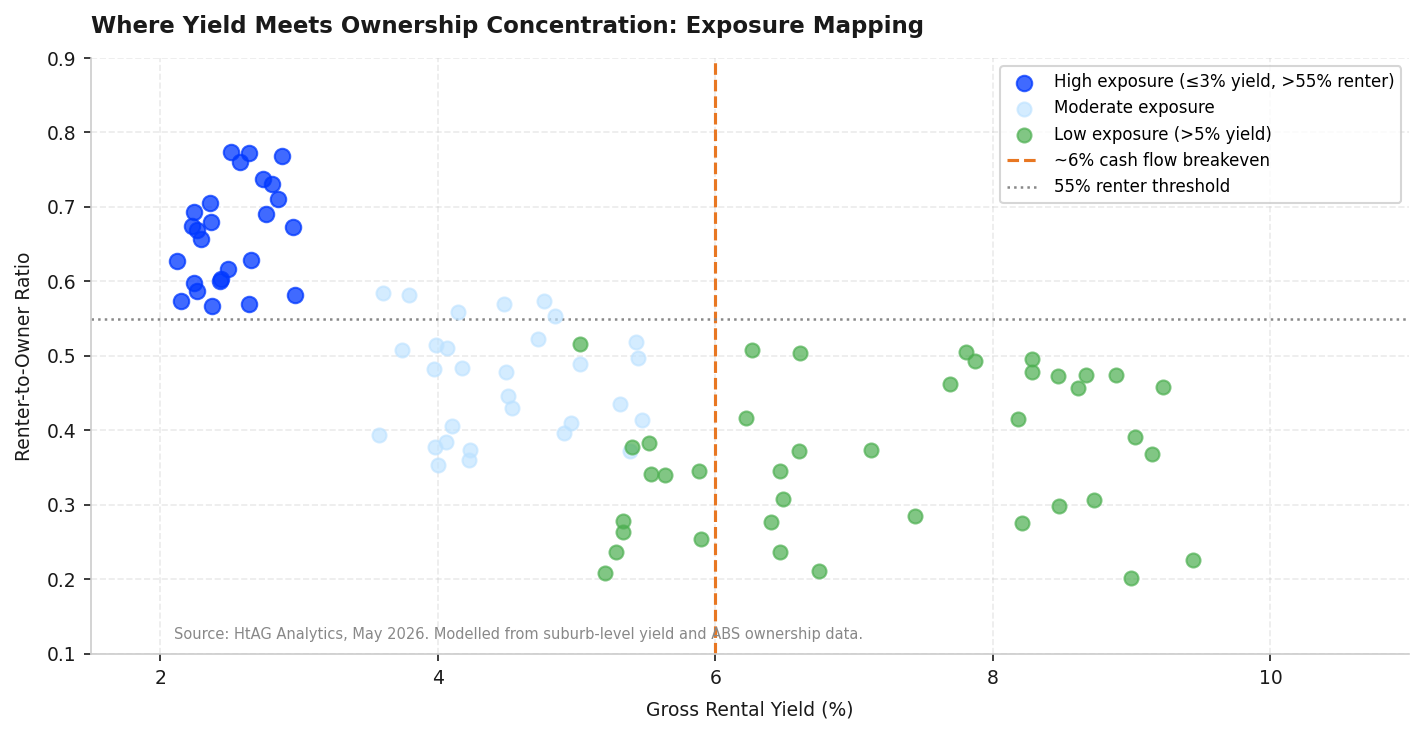
HtAG Analytics mapped every Australian suburb against two conditions: a renter-to-owner ratio above 55%, and a gross rental yield under 3%. Only 26 suburbs nationally met both thresholds as of May 2026. The concentration is not where most investors expect it. Fifteen sit in New South Wales, seven in Queensland, three in Victoria, and one in South Australia.
That shift also changes how carried-forward losses interact with your finances day to day. They no longer reduce assessable wage income. That is worth checking against your borrowing capacity formula if you are planning your next purchase around the old rules.
Chart 2: Australia's Most Exposed Suburbs to the 2027 Negative Gearing Reforms
Source: HtAG Analytics, Investor Exposure Index, May 2026
Independent modelling puts the average national price effect around 4.6%, rising to 8.3% across Greater Sydney and Melbourne specifically. That is a starting point for a conversation with your accountant, not a reason to panic-sell, but it is worth comparing against the federal budget property investor impact analysis before assuming your suburb sits outside the exposed cohort.
What Do Negative Gearing Exposed Suburbs Have in Common?
The exposure pattern is more specific than "expensive suburb." Every suburb on the exposed list shares two features at once: high investor concentration and a yield too thin to cover holding costs from rent alone.
The median exposed suburb runs a 2.7% yield with a 60% renter share. That combination means the typical property in that cohort is losing money on a cash flow basis before any tax benefit is applied, and a majority of its neighbours are in the same position.
When renter concentration is this high, a change in investor behaviour tends to show up in listing volumes at the suburb level first, not just for a single owner. Contrast that with suburbs carrying tighter rental vacancy rates, where strong tenant demand tends to support both yield and occupancy simultaneously.
Chart 3: Where Yield Meets Ownership Concentration
Source: HtAG Analytics, Investor Exposure Index, May 2026

Does a Higher Rental Yield Reduce Your Negative Gearing Reliance?
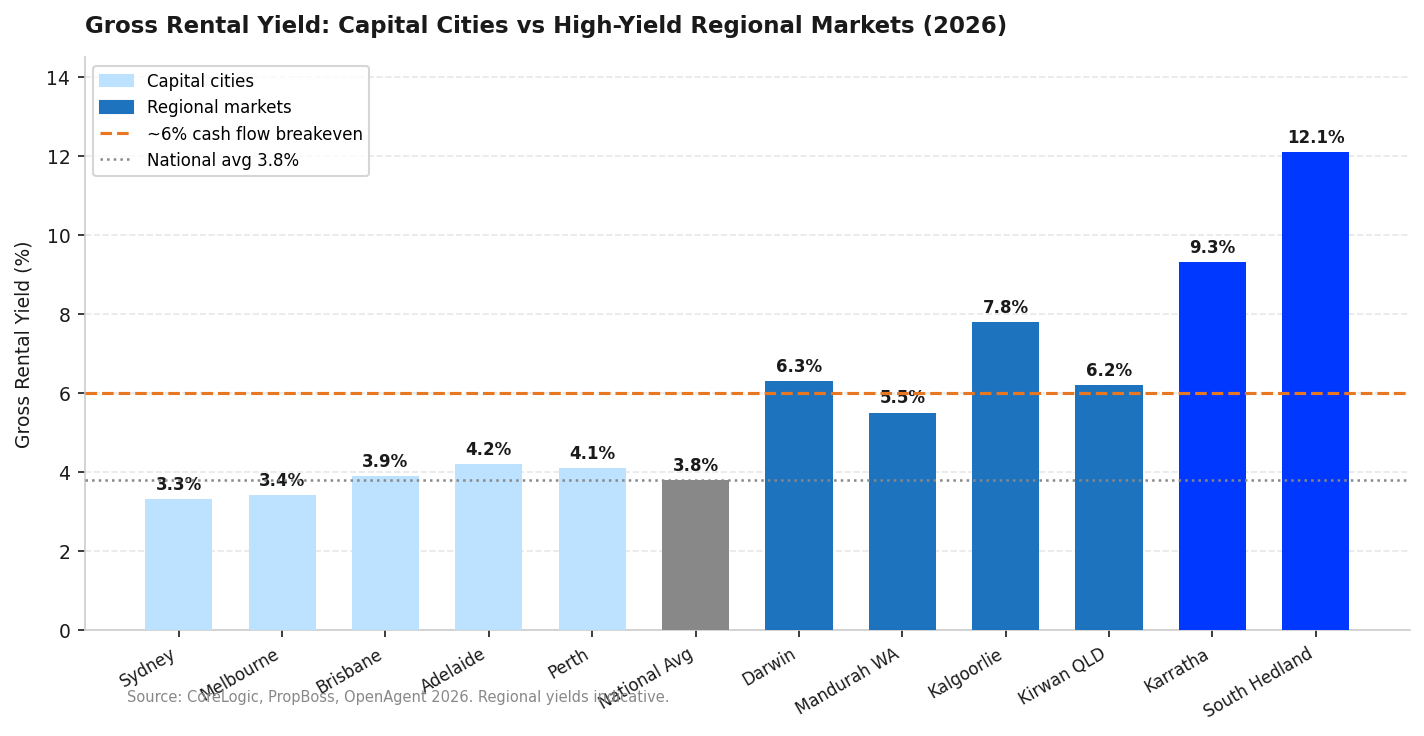
The intuitive answer is yes. But 5% is not the number that clears the exposure zone. National gross rental yields fell from 4.92% in September quarter 2025 to 4.69% by March quarter 2026. Capital city houses typically sit between 3% and 4.5%, the same band the exposed suburbs occupy.
A 5% yield helps. But once rates, insurance, management fees, and maintenance are added, many investors do not reach a genuinely neutral cash flow position until closer to 6%. That gap matters because it is the difference between does rental income actually help borrowing capacity and whether it just offsets costs.
Chart 4: Gross Rental Yield — Capital Cities vs High-Yield Regional Markets
Source: CoreLogic, PropBoss, OpenAgent, 2026. Regional yields indicative.
That gap is why testing the yield hypothesis matters more than assuming it. A balanced yield versus growth strategy still needs a realistic yield floor, and 5% alone will not clear it once real costs are included. Comparing gross rental yields across Brisbane and Perth is a reasonable middle ground between capital city liquidity and regional yield.
Who Actually Benefits From Negative Gearing Right Now?
Negative gearing and the CGT discount reduced personal income tax revenue by an estimated $10.9 billion in the 2023-24 financial year, up from $6.7 billion a decade earlier. The more useful question for an individual investor is not the total cost, but who actually receives that benefit.
Parliamentary Budget Office analysis of 2024-25 tax data found the top 10% of income earners receive 43% of the negative gearing deduction benefit and 80% of the CGT discount benefit. The bottom 50% receive just 15% and 6% respectively.
That also explains why the distributional complaint about negative gearing has always been louder among economists than among middle-income investors. For a nurse or a teacher who owns one investment property in Australia, the actual dollar saving from negative gearing may be modest. The CGT discount change is likely to affect that group more at sale.
Chart 5: Who Actually Benefits from Negative Gearing and the CGT Discount (2024-25)
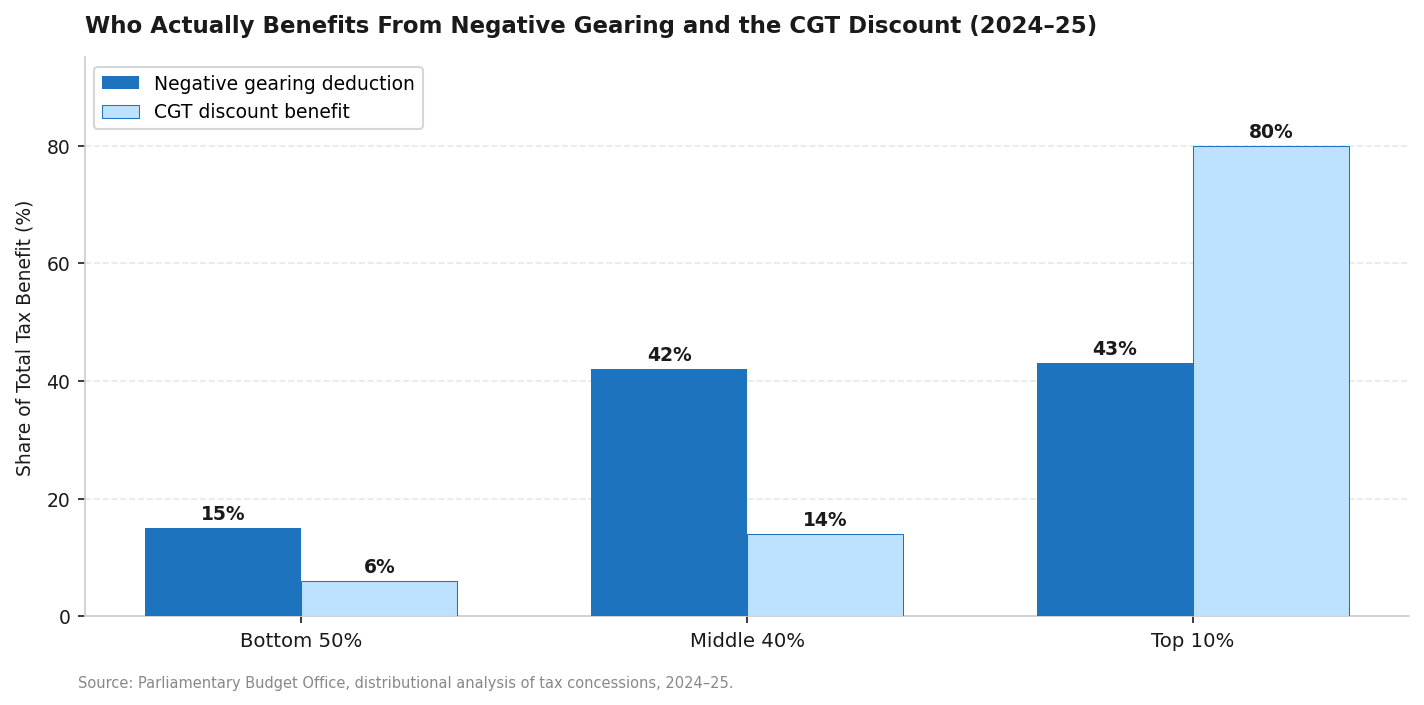
Source: Parliamentary Budget Office, distributional analysis of tax concessions, 2024-25
What This Means for Your Own Negative Gearing Property Investment
Whether the reforms matter to you depends on three things: when you bought, what your property currently yields, and how concentrated your suburb is with other investors in the same position.
Start with the purchase date. Anything acquired before 12 May 2026 keeps its existing deduction rights for as long as you hold it. Next, check your actual yield against rent, not against the price you paid. If rental income already supports a meaningful share of your holding costs, your property is closer to the low-exposure end of the spectrum than the high-exposure end.
Then look at your suburb's investor concentration. A high renter share is not automatically a problem if the yield is strong enough. It becomes a problem when high investor concentration meets a yield under 3%, the exact signature the exposed suburb list identifies. Reviewing your maximum borrowing capacity against your actual risk position is a useful next step once you know where your property sits.
Final Thoughts
The 2027 negative gearing changes are not a blanket risk across the property market. They concentrate on a specific, identifiable profile: established, investor-heavy suburbs running rental losses under a 3% yield. That profile is common in inner Sydney and Melbourne. It is rare in Karratha, Kirwan, or Kalgoorlie.
If your property sits well clear of that profile, the reforms are a policy detail to note rather than a reason to act. If it sits close to it, the honest move is to run the numbers now rather than wait for the 2027 start date to force the question.
Either way, this sits inside the broader question of property investment strategy in Australia right now, not just one policy change.
Frequently Asked Questions

Recommended Reading
Two pages selected based on what readers of this article are most likely to need next.
Recommended Video
As of April 2026, Treasury is actively modelling potential changes ahead of the May Budget. This isn’t speculation—it’s confirmed. In this video, we unpack exactly what’s being proposed, who stands to benefit, who could be impacted, and what it could mean for investors, renters, and first home buyers across Australia.